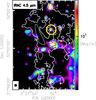
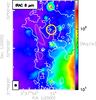
Fig. 5

Mid-infrared emission observed towards I05345 with the Spitzer Space Telescope. The two colour images show the Spitzer IRAC bands centred at 4.5 (top panel) and 8 μm (bottom panel). The white contour indicates the ammonia (1, 1) emission and is the same as in Fig. 4. The yellow circle about 15′′ above C1-a pinpoints the location of the 4.5 μm source discussed in the text (as in Fig. 4), and the other symbols indicate the location of the cores as in Fig. 1. The two grey contours represent the 3σ level of the N2D+ (3−2) integrated emission, and are the same as the blue contours in Fig. 1. In each panel, The VLA synthesised beam is shown in the bottom-left corner.
Current usage metrics show cumulative count of Article Views (full-text article views including HTML views, PDF and ePub downloads, according to the available data) and Abstracts Views on Vision4Press platform.
Data correspond to usage on the plateform after 2015. The current usage metrics is available 48-96 hours after online publication and is updated daily on week days.
Initial download of the metrics may take a while.