Fig. 4
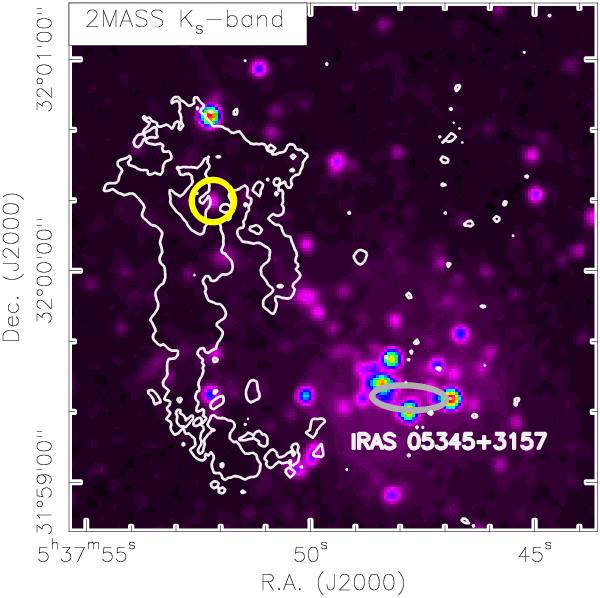
2MASS Ks-band image of the region associated with IRAS 05345+3157 (colour scale). The white contour represents the 6% level of the maximum (~0.039 Jy beam-1 km s-1) of the NH3 (1, 1) zero-th order moment map. The yellow circle centred roughly at Dec +32°00′20′′ pinpoints the location of the 4.5 μm source discussed in the text (Sect. 3.2.1). The position error of the IRAS source is indicated by the grey ellipse.
Current usage metrics show cumulative count of Article Views (full-text article views including HTML views, PDF and ePub downloads, according to the available data) and Abstracts Views on Vision4Press platform.
Data correspond to usage on the plateform after 2015. The current usage metrics is available 48-96 hours after online publication and is updated daily on week days.
Initial download of the metrics may take a while.