Fig. 2
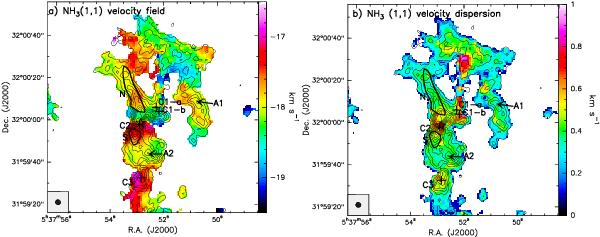
a) first-order moment map (colour scale) of the NH3 (1, 1) main group of hyperfine components. Same contour levels as in the left panel of Fig. 1 are shown. The synthesised beam of the NH3 (1, 1) VLA observations is shown in the bottom-left corner. The symbols have the same meaning as in Fig. 1; b) same as panel a) for the second-order moment.
Current usage metrics show cumulative count of Article Views (full-text article views including HTML views, PDF and ePub downloads, according to the available data) and Abstracts Views on Vision4Press platform.
Data correspond to usage on the plateform after 2015. The current usage metrics is available 48-96 hours after online publication and is updated daily on week days.
Initial download of the metrics may take a while.