Fig. 10
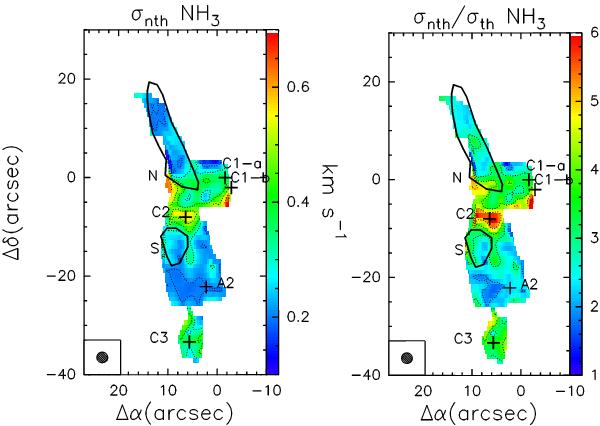
Map of the non-thermal velocity dispersion (σnth, left panel) and ratio between non-thermal and thermal contribution to the observed velocity dispersion (σnth/σth, right panel). In the left panel, the contour levels (dotted contours) range from 0.2 to 0.6 km s-1, in steps of 0.1 km s-1, while in the right panel they range from 1 to 6, in steps of 1. Crosses and solid contours indicate the millimetre continuum cores and the N2D+ cores, respectively, as in Figs. 3 and 1.
Current usage metrics show cumulative count of Article Views (full-text article views including HTML views, PDF and ePub downloads, according to the available data) and Abstracts Views on Vision4Press platform.
Data correspond to usage on the plateform after 2015. The current usage metrics is available 48-96 hours after online publication and is updated daily on week days.
Initial download of the metrics may take a while.