Fig. 3
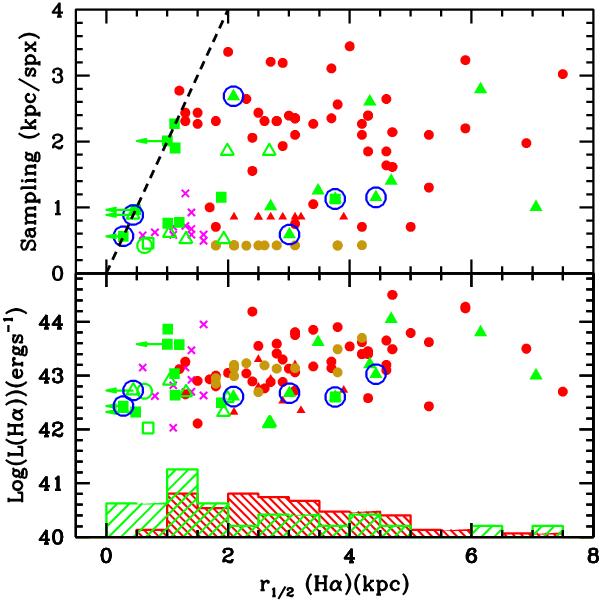
Deconvolved half-light radius derived using the Curve of Growth method as a function of the reddening corrected Hα luminosity (lower panel) and the spatial sampling (upper panel). For the local U/LIRG sample (green symbols), we used the same code as in Fig. 1. Only the local U/LIRGs with (reddening corrected) Hα luminosities above 1042 erg s-1 and observed with a spatial resolution similar to that achieved for distant galaxies (i.e. sampling >400 pc spx-1) are considered. The high-z SFG samples are represented with the following symbol code: Red circles, SINS sample (Forster-Schreiber et al. 2009); magenta crosses, Law et al. (2009); red triangles, Wright et al. (2009); orange circles, Wisnioski et al. (2011). Typical errors in r1/2 range from 30 to 50 percent (for detailed individual errors see Table 2). The dashed line in the upper panel approximately defines the region out of reach owing to the limited resolution (i.e. left of the line). The cases for which the derived radii were equal to or smaller than those of a point source are shown as upper limits. The histograms for the local (green) and high-z (red) samples are normalized to the total number of objects in each sample.
Current usage metrics show cumulative count of Article Views (full-text article views including HTML views, PDF and ePub downloads, according to the available data) and Abstracts Views on Vision4Press platform.
Data correspond to usage on the plateform after 2015. The current usage metrics is available 48-96 hours after online publication and is updated daily on week days.
Initial download of the metrics may take a while.