| Issue |
A&A
Volume 541, May 2012
|
|
|---|---|---|
| Article Number | A159 | |
| Number of page(s) | 10 | |
| Section | Planets and planetary systems | |
| DOI | https://doi.org/10.1051/0004-6361/201118004 | |
| Published online | 22 May 2012 | |
Photometric observations of comet 81P/Wild 2 during the 2010 perihelion passage⋆
1
Center of Studies and Activities for Space (CISAS) “G. Colombo”, University
of Padua,
via Venezia 15,
35131
Padova,
Italy
e-mail: This email address is being protected from spambots. You need JavaScript enabled to view it.
2
Department of Physics and Astronomy “Galileo Galilei”, University
of Padua, Vic. Osservatorio
3, 35122
Padova,
Italy
3
Deutsches Zentrum für Luft- und Raumfahrt (DLR), Institut für
Raumfahrtsysteme, Robert-Hooke-Str.
7, 28359
Bremen,
Germany
4
INAF – Astronomical Observatory of Padua,
Vic. Osservatorio
5, 35122
Padova,
Italy
5
European Space Astronomy Center (ESA-ESAC), PO Box 78,
28691
Villanueva de la Cañada – Madrid,
Spain
6 NASA Lunar Science Institute, Center for Lunar Origin and
Evolution, Southwest Research Institute, 1050 Walnut St., Suite 300, 80302 Boulder, Co.,
USA
Received: 2 September 2011
Accepted: 20 March 2012
Abstract
Context. The Jupiter-family comet 81P/Wild 2, target of the NASA Stardust mission, is very important in the context of the studies of pristine objects in the solar system. First, it was only recently deflected into the present orbit, having spent at least 300 yr at higher heliocentric distance prior to the orbital change in 1974. It is therefore likely that the comet experienced a recent activation with consequent low alteration of its original material. Second, it is the only comet whose coma material was brought back to Earth for laboratory analysis. We observed the object between 2010 February 9 and September 9 for a total of 11 nights during the 2010 perihelion passage.
Aims. The goals of the campaign were the characterization of the comet’s dust activity and the comparison with previous apparitions to derive hints on the secular behavior of the object.
Methods. Broadband R- and I-images were acquired using three instruments: ALFOSC, CAMELOT, and TCP. The first one is mounted at the Nordic Optical Telescope on La Palma, while the second and the third are mounted at the Instituto de Astrofisica de Canarias 0.82-m telescope on Tenerife. We analyzed the presence and variability of dust structures in the coma with image-enhancing techniques, the radial profile of the dust brightness, and we measured the dust production rate and the dust reddening.
Results. We found evidence of a long-lasting sunward fan and anti-solar tail activity throughout all our observations up to a heliocentric distance of 2.42 AU. Afρ measurements suggest a pre-perihelion peak of the activity, caused by a seasonal effect, plus two post-perihelion outbursts. Both spatial and Afρ radial profiles indicate a steady-state coma at nucleocentric distances greater than ~1000–2000 km. The color analysis reveals a moderately reddened dust with a 6–9%/1000 Å reddening, consistent with the current picture of cometary dust. The second outburst emitted dust with lower reddening.
Conclusions. The comparison with previous perihelion passages points toward a recurrent main activity always driven by the same areas on the nucleus, producing dust with similar characteristics and in similar coma structures in different years. Our Afρ measurement at the longest heliocentric distance suggests the comet was less dust-productive in 2010, pointing toward a possible secular aging of the object and its activity. The change of dust colors during the unusual second outburst suggests that an internal part of the nucleus has different physical properties compared with those that produce the recurrent main activity, pointing toward a heterogeneous comet.
Key words: comets: general / comets: individual: 81P/Wild 2 / techniques: photometric
This article is based on observations made with the 2.56-m Nordic Optical Telescope (NOT) and the 0.82-m IAC-80 Telescope. The NOT is operated on the island of La Palma jointly by Denmark, Finland, Iceland, Norway, and Sweden, in the Spanish Observatorio del Roque de los Muchachos of the Instituto de Astrofisica de Canarias. The 0.82-m IAC-80 Telescope is operated on the island of Tenerife by the Instituto de Astrofisica de Canarias in the Spanish Observatorio del Teide.
© ESO, 2012
1. Introduction
Comets are commonly believed to be the most pristine, poorest evolved objects of our solar system. Their study therefore gives precious hints about the original materials and environment conditions from which planets, moons, and small bodies formed. Dust is one of the main components in comets, together with ices consisting of volatile elements, and the analysis of its properties is of primary importance in understanding the physics of these primitive objects and the birth of the solar system.
In this context the study of the Jupiter-family (JF) comet 81P/Wild 2, hereafter 81P, assumes exceptional importance for two main reasons. First, it was recently deflected into the present orbit by a close encounter with Jupiter in 1974 (Wild & Marsden 1978). This approach to the giant planet, with a closest distance of 0.0061 AU, caused the comet’s perihelion and aphelion distances to decrease from 5.0 to 1.5 AU, and from 24.7 to 5.2 AU, respectively. It was also found that the comet underwent no major transformation of the orbit during the past 300 yr prior to 1974 (Sekanina & Yeomans 1985). It is therefore likely that 81P experienced only recently activation processes with consequent low alteration of its original material. Second, it was the first, and so-far only, comet visited by a spacecraft, the NASA’s Stardust mission in 2004, whose coma solid material was collected in-situ and subsequently brought back to Earth for laboratory analysis (e.g. Burnett 2006). These studies produced a vast amount of scientific results that greatly helped broadening our knowledge of cometary formation in the protoplanetary disk. For a review of these findings we refer the reader to Burchell & Kearsley (2009) and references therein. The most striking discovery were crystalline silicates in 81P’s dust. Their presence in cometary dust was previously only inferred from infrared spectral data modeling. As summarized in Westphal et al. (2009), crystalline silicates are unexpected if comets are composed of pristine interstellar material, since interstellar silicates are almost entirely amorphous. Heating to temperatures greater than 1100 K can anneal silicates to crystallinity, but no protoplanetary heating sources have been identified that were sufficiently strong to heat materials in the outer nebula, where comets are believed to form, to such high temperatures. Possible explanation scenarios reinforced the conclusion that large-scale mixing indeed played a key role in the small bodies’ formation in the protoplanetary disk (Bockelée-Morvan et al. 2002; Boss 2008).
To support the Stardust mission, 81P was the target of an extensive observational campaign before the spacecraft encounter, which made this object one of the best-known comets in science (Fink et al. 1999; Mäkinen et al. 2001; Hanner & Hayward 2003; Ishiguro et al. 2003; Schulz et al. 2003; Sekanina 2003; Farnham & Schleicher 2005; Ferrín 2007).
After the observational unfavorable perihelion passage of 2003, comet 81P returned to the inner solar system between the end of 2009 and 2010, reaching the heliocentric and geocentric closest distances of 1.6 and 0.7 AU on 2010 February 22 and 2010 April 6, respectively.
We monitored comet 81P with broadband photometric observations from 2010 February 9 to 2010 September 9 for a total of 11 observing nights. The scientific goals of the campaign were to assess the properties of the dust component and its evolution during the 2010 perihelion passage and to compare our results with previous observations giving hints on the secular behavior of the comet. In this paper we present the analysis of dust structures present in the inner coma, the dust production rate, the azimuthally averaged radial profiles of the coma, and dust reddening. The composition of Stardust samples as derived from laboratory results was used as input in our modeling of the remotely observed dust.
2. Observations and data reduction
The comet was observed from the 2.56-m NOT at the Roque de los Muchachos Observatory on La Palma, Spain, at the beginning of February 2010. The data presented here were taken with the Andalucia Faint Object Spectrograph and Camera (ALFOSC)1, which is owned by the Instituto de Astrofisica de Andalucia (IAA) and operated at the NOT under agreement between IAA and the Niels Bohr Institute for Astronomy, Physics and Geophysics (NBIfAFG) of the Astronomical Observatory of Copenhagen. The camera is equipped with a 2048 × 2048 pixels CCD with a plate scale of 0.19″/px, corresponding to a field of view (FoV) of 6.5′ × 6.5′. Images were taken in the Bessel-R and interference-i broadband filters. These filters were chosen because they are less affected by gaseous emission bands than other broadband filters located in the blue to green spectral range (e.g. Schulz et al. 2003; Hadamcik & Levasseur-Regourd 2009). All other observations were performed with the 0.8-m Instituto de Astrofisica de Canarias (IAC-80) telescope at the Observatorio del Teide, Tenerife, Spain. Images in March 2010 and in the May-September period were taken with the Camara Mejorada Ligera del Observatorio del Teide (CAMELOT)2, with a 2048 × 2048 pixels CCD, pixel scale of 0.304″/px and FoV of 10.4′ × 10.4′ in Bessel R and I broadband filters. Data in April were acquired with the Tromsø CCD Photometer Camera (TCP)3, characterized by 1024 × 1024 pixels, scale of 0.54″/px and FoV of 9.2′ × 9.2′ with Bessel R and I broadband filters. The log of all observations is reported in Table 1.
In the general guideline of data acquisition, series of several consecutive images per used filter were obtained. Appropriate bias and dome flat-field frames were taken for usual bias subtraction and flat-fielding normalization in the data reduction. A proper sky subtraction was performed measuring the sky statistics in regions of blank sky near, but not adjacent, to the object to avoid the contaminating effects of the coma background. To perform the absolute flux calibration of our science frames, we took images of photometric standard stars in Landolt fields (Landolt 2009) at airmasses similar to the comet observations, and we applied the methodology described in Palmer & Davenhall (2001). The comet images were therefore calibrated using the Johnson-Kron-Cousins photometric system used by Landolt (2009). The extinction correction was performed assuming the standard atmospheric conditions for La Palma4 and Tenerife5. Series of calibrated images from the same night were median-combined to increase the signal-to-noise (S/N) ratio and to reduce the contaminating flux of background stars as much as possible.
Log of photometric observations in R and I broadband filters.
3. Coma structures
R-band data were analyzed with image enhancing techniques to reveal possible structures inside the coma. We used the rotational gradient Larson-Sekanina (Larson & Sekanina 1984) and derivative adaptive Laplace (Boehnhardt & Birkle 1994, and references therein) filtering. The Larson-Sekanina algorithm is a very powerful tool to detect the finest details of the structures, but is quite sensitive to noise. The adaptive Laplace procedure is, in contrast, more robust in detecting coma features with a high noise level as well, but the adaptive smoothing is also affecting the finest details, which often hinders the measurements of the structure size (Vincent 2010). The Laplace filter width was chosen after extensive tests in order to obtain the best enhancement of the coma structures and, contemporaneously, deal with comparable results from different dates. The best solution was found using a width of 15 and 23 pixel for images taken with the NOT and IAC-80 telescopes, respectively. As an additional independent verification of the existence of features we also checked for anisotropies in the inner coma isophotes of the calibrated images.
The first available image, the only one taken with the 2.56-m NOT telescope on 2010 February 9, with the lowest pixel scale of 123 km/px, shows two fan-like structures and a collimated jet in the sunward hemisphere and an anti-solar tail (Figs. 1b and c). The fan-like structures were named A and B following a counterclockwise notation starting from the celestial north, while the collimated jet and the anti-solar tail are indicated as C and T, respectively. B appears to be the broader and brighter structure. A and B extend up to ~37 000 km from the nucleus when they curve under the action of the nucleus rotation and the solar radiation pressure, contributing to the formation of the coma (Fig. 1d). The isophotes of the image are clearly distorted in the direction of the structures (Fig. 1a). The position angle, PA, and the width at a nucleocentric distance of 10 000 km of all the structures mentioned in this section are reported in Table 2. The PA of a feature is the center position of the Gaussian fit to its azimuthal profile. The given width represents the computed full width at half maximum (FWHM) of the Gaussian fit.
Unfortunately, the combination of lower resolution and S/N ratio values on subsequent dates prevented us from tracking the evolution of the aforementioned sunward structures in detail.
In March we detected an anti-solar tail and an evident fan-like sunward activity, named SA for “sunward activity”, which possibly is the envelope of several finer structures hidden inside it (Figs. 1f and g).
In April the tail disappeared because of the observing geometry: the phase angle was very low and the tail pointed away from the Earth. In May we observed a faint noisy structure in the anti-solar direction and identified it as the tail. In these two months we saw two broad structures, one on the sunward side, which we still called SA, and one in the anti-sunward side, named AA for “anti-sunward activity” (Fig. 1j). The SA is the dominant feature of the comet and is clearly visible in the isophotes and in the filtered images (Figs. 1i–k). In contrast, AA and the tail are revealed only by the Larson-Sekanina analysis. The AA may be interpreted as a new fan or a structure that previously appeared perspectively overlapped on the sunward side. We emphasize that it is possible that the coma features that we indicate with the same letters are the same structures, which originate from the same source throughout our observations. However, we do not claim to prove this by our modeling.
From June on the phase angle is large enough to allow the clear detection of the anti-solar tail and a strictly fan-shaped sunward activity (Figs. 1n and o).
This pattern is the same up to our last observation on 2010 September 9 at 2.42 AU from the Sun and 2.47 AU from the Earth. These data show a clear sunward activity in the isophotes anisotropy and in the enhanced filtered images but the tail manifests as a low-intensity feature very close to the background noise level (Figs. 1q–s).
The dust structure on the sunward side has an almost constant projected position on a timescale of months and there is no clear evidence of rotational modulation (Table 2). A likely interpretation of the comet’s dust production is that the sunward fan SA is the product of a source on the comet’s nucleus, which possibly is mainly responsible for the comet’s activity.
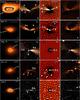 |
Fig. 1 Coma structures found at different dates from R-band data with image-enhancing techniques. First, second, third, and fourth column shows an isophotal representation of the corresponding original image, Larson-Sekanina and adaptive Laplace filtering results, and a large field of view Larson-Sekanina frame to show the curvature of the sunward dust activity at long nucleocentric distances, respectively. The Laplace filter width used was 15 px on 2010 February 9 and 23 px on all other dates. All images are oriented north-up, east-left. Arrows pointing S give the position of the Sun in the frames. The horizontal bar in the upper right corners corresponds to a scale length of 10 000 km. |
Geometry of the coma features found with image-enhancing techniques.
4. Af ρ
The dust production rate was derived with optical measurements of the A(α)fρ parameter in cm, where A(α) is the dust albedo at the considered phase angle, f is the so-called filling factor, and ρ the projected nucleocentric aperture radius (A’Hearn et al. 1984). This parameter is a function of the observing geometry, the measured cometary flux inside the photometric aperture, and the solar flux in the same filter. The solar flux term was obtained convolving the solar spectrum by Burlov-Vasiljev et al. (1995) and Burlov-Vasiljev et al. (1998) with the response of the used instrument-filter combinations.
The radial profiles Afρ vs. ρ in both R and I bands are characterized by a steep increase in the first ~1000–2000 km from the nucleus, depending on the date, followed by a smooth decrease at longer nucleocentric distances. The steep increase for small ρ was measured beyond the distance of the smearing caused by the seeing. A similar trend with lower spatial resolution was found by Lin et al. (2010) during January 2010. Starting from June on the decrease at larger ρ turns to an approximately constant value, independent of ρ. A sample portrait of these two behaviors is shown in Fig. 2. An error around 10% on the measures can be estimated from the absolute flux calibration, as already assumed in previous analogous cometary photometric studies (e.g Schulz et al. 2003; Tozzi et al. 2007; Bertini et al. 2009; Lara et al. 2011). In our analysis of the Afρ profiles we considered the longest nucleocentric distances to be corresponding to ρ ~50 000 km except in the last observations on September 9. These values corresponded to distances always beyond the apparent extent of the coma in the Sun direction. Higher ρ values were discharged to reduce the influence on the photometry of contamination by stars and possible sky-background residuals. On September 9 the maximum ρ was set to ~25 000 km since this was the apparent maximum extent of the coma in the images. Because the condition of a cometary coma in a steady state (i.e. with constant dust production and outflow speed together with the conservation of dust grains) would translate into Afρ independent of the aperture, its sharp increase in the inner coma indicates that the nature of the released dust and/or its motion are subject to changes, at least for ρ ≲ 1000–2000 km. Similar trends of Afρ vs. ρ, including the steep increase at small ρ with a comparable scale length, were already observed in several other comets at various heliocentric distances. We cite the data regarding comets C/1999 S4 (LINEAR) by Bonev et al. (2002) and Tozzi & Licandro (2002), C/2000 WM1 (LINEAR) by Lara et al. (2004) and Tozzi et al. (2004), 9P/Tempel 1 by Tozzi et al. (2007), C/2007 N3 (Lulin) by Woodward et al. (2011), and 67P/Churyumov–Gerasimenko by Tozzi et al. (2011). An intriguing explanation for the steepness of the Afρ profiles, or equivalently of those of its derived parameter ΣAf (Tozzi & Licandro 2002), close to the nucleus was proposed by Tozzi et al. (2004) for comet C/2000 WM1 (LINEAR). The authors interpreted the data as evidence of organic material in the emitted dust, sublimating while heated by the solar radiation. A similar explanation was proposed also for comet 9P/Tempel 1 by Tozzi et al. (2007) but invoking a different nature of the dust grains. Although additional modeling is necessary to drive quantitative conclusions, we are inclined to think that sublimation of dust grains relatively close to the nucleus may be a valuable explanation also for 81P’s Afρ profiles at ρ ≲ 1000–2000 km.
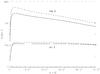 |
Fig. 2 Afρ versus the nucleocentric distance ρ during 2010 February 9 and July 3. Continuous and dashed lines represent data taken in R and I bands, respectively. |
To properly compare the data values from different dates, the so-called phase effect caused by the intrinsic dust light-scattering properties at different phase angle must be removed. In this way only the variations caused by the temporal changes of the cometary activity can be measured. This was performed by reducing all A(α)fρ measurements to α = 0°, A(0)fρ, as reference. This correction was made with a phase function for cometary dust, which can be derived from a theoretical model of its intimate nature and scattering behavior, as already performed for comet 73P/Schwassmann-Wachmann 3 in Bertini et al. (2009). We considered the average scattering behavior of the entire coma, without taking into account possible dust-parameter variations as a function of the distance from the nucleus. We used compact irregular fractal structures comparable in size with the incident wavelength to simulate the emitted dust particles because they have shown to provide the most accurate fits to the observed dust scattering properties in the visible range (Bertini et al. 2007). A power-law grain size distribution, n(r) ~ r−a, with a = 2.6 was used in our modeling, because our results are not sensitive to the choice of the exponent in the range a = [2−3] . This range of values for the size distribution exponent is justified by the results of previous studies on comets. Indeed, it was shown by observational and theoretical works that an exponent ~3 can be considered typical of dust in cometary comae (e.g. Fulle et al. 1997; Fulle 2000; Fulle et al. 2000; Epifani et al. 2001; Keller et al. 2007). Moreover, analyzing the properties of the dust emitted by 81P, Price et al. (2010) derived specific values of a, modeling the flux of impacts by dust particles on aluminum foils onboard the Stardust spacecraft during the 2004 flyby. The authors found a ~ 2 when considering particles smaller than 10 μm in size. An intermediate exponent value between 2 and 3 therefore appears to be an ideal choice for describing the size distribution of the small dust particles that mainly contribute to the brightness of the coma observed in our images at red wavelengths. Another parameter influencing the scattering phase function is the dust composition. It has therefore to be taken into account in the phase effect correction. The laboratory analysis of the material brought back to Earth by the Stardust mission revealed that comet 81P’s dust consists of a mixture of minerals, mainly silicates and organics (Brownlee et al. 2006). Following these findings, three possible dust compositions were taken into account in the A(α)fρ reduction to phase angle zero: pure silicates, pure organics, and a 1:1 in mass mixture of silicates and organics. For a detailed description of the dust model used, including the bulk density and the complex refractive index of the dust particles, we refer the reader to Bertini et al. (2007).
In Fig. 3 the values of A(α)fρ and A(0)fρ, measured according to the three different compositions taken into account in the R-band data for a reference nucleocentric distance ρ = 10 000 km, are shown against the corresponding days from the perihelion date. Although the largest differences with respect to A(α)fρ are found assuming a pure silicate dust, the overall shape of the behavior is not significatively changing with the phase angle correction for all compositions taken into account. The dust production rate decreases up to few days after perihelion, suggesting a peak of the activity owing to a seasonal effect before is reached the closest distance to the Sun. Two increments of the activity are detected in our observations, peaking around 60 and 160 days after perihelion. Once the observed flux is translated into the absolute magnitude H10 (Vsekhsvyatskii 1963, and references therein), we note that the first and second peak increments the comet’s brightness by more than half and almost one magnitude with respect to the data from the previous closest date, respectively (Fig. 4). This overall tendency is confirmed by amateur results with higher temporal resolution6. Our 2010 April 22 and May 3 Afρ results are compatible within the error bars with the findings of Lin et al. (2010) for dates close in time. From the analysis of the dust structures in Sect. 3 we see no relevant changes of the strong sunward fan, which may be connected with the main activity source on the comet’s nucleus. The appearance of the antisunward fan AA during April may at first sight suggest a relation with the first outburst, but the increase of dust production started already in late March, when no antisunward structure was present. On the other hand, AA is a very faint structure and can therefore hardly be invoked as the source of the notable increment of the activity. We also see no evidence in our images of nucleus break-up events in correspondence, or close to, the two outbursts. From this picture we conclude that these events are most probably caused by the temporal evolution of the areas in the nucleus responsible for the main activity.
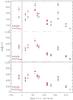 |
Fig. 3 Afρ versus the days from perihelion date measured at the nucleocentric distance of 10 000 km in R-band data. Black dots represent the original A(α)fρ values without phase-effect correction. Red triangles (a), rhombuses (b), and squares (c) are the reduced A(0)fρ values considering a pure silicate, pure organic, and mixed composition, respectively. The error bars are derived from the 10% uncertainty in the Afρ measurements. The two arrows in (a) mark the Afρ measurements during the two post-perihelion outburst events. |
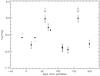 |
Fig. 4 R-band 81P absolute magnitude, H10, versus the days from perihelion date. The two arrows mark the H10 measurements during the two post-perihelion outburst events. |
5. Spatial profiles
Another way to analyze the overall dust coma behavior is through the azimuthally averaged profiles of the continuum intensity around the comet’s optocenter in R-band images. These profiles give hints on the applicability of the fountain model to the comet’s coma. In the ideal fountain model (Eddington 1910; Wallace et al. 1958), where an idealized spherically symmetric steady-state coma, in which the equation of continuity is satisfied, is produced by a source of continuous strength, the coma brightness, B, varies as ~1/ρ, as already mentioned in Sect. 4. This intensity can therefore be described by a straight line with slope m = −1 if expressed in a log-log representation against ρ. Deviations from a pure inverse-distance relationship reflect changes in the comet’s dust component. Several processes can steepen or flatten out the brightness profiles. Dust acceleration or a lateral dust flow can increase the slope, while optical depth effects and extended or secondary sources act to flatten it. Depending on its exact nature, dust fragmentation or sublimation of ices from the grain surface can increase or decrease the slope, and modulation of the dust production rate can produce unusual changes in the profile (Farnham 2009, and references therein). Jewitt & Meech (1987) showed that a limiting case of a steady-state coma profile distorted by solar radiation pressure, generally at distances ρ > ρR, where ρR is the extent of the coma in the Sun direction, is represented by a slope of m = −1.5.
The least-squares fits to the log(B) vs. log(ρ) behavior were performed by discarding the first few pixels around the comet optocenter, corresponding to the size of the seeing disk. This was made to remove from the analysis the artificial flattening of the profiles caused by their oversamplying in the inner part because the pixel scale was significantly smaller than the seeing disk. The seeing disk was measured during each observing session through the photometric analysis of the background stars. This resulted in considering ρ to be greater than ~500 km at the comet at the beginning of our campaign and greater than ~1600 km at the end of the observations due to the increased geocentric distance. The upper limits in ρ were determined as in the Afρ analysis. The values of the slopes of these fits, m, are plotted in Fig. 5 against the days from perihelion. Root mean-square errors on m calculation were always lower than 1%.
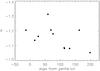 |
Fig. 5 Values of the log(B) vs. log(ρ) slope, m, versus the days from perihelion for R-band observations. The standard deviation of these fits is always <1%. |
Clearly, the measured trend is compatible with the Afρ temporal evolution. The steepening of the profiles in correspondence with outburst events is a phenomenon already observed in other comets (e.g. 29P/Schwassmann-Wachmann 1, Nakamura et al. 1991; and 73P/Schwassmann-Wachmann 3, Bonev et al. 2008; Bertini et al. 2009) and provides an additional proof of the increase of the comet’s activity in our April and August 2010 data. All our m measures fall inside the [− 1.4, −1.0] interval. Since the brightness slopes are measured up to nucleocentric distances beyond ρr, it is no surprise that they deviate from the strictly m = −1 behavior because in their determination sections of the coma where the radiation pressure is already acting are included. In summary, we can state that 81P’s coma behavior is consistent with an ideal fountain model where the radiation pressure effects are taken into account. Therefore, the spatial profile analysis gives no indications of fragmentation, sublimation, or dust rate change processes up to ~50 000 km from the nucleus. In contrast, the Afρ profiles described in Sect. 4 show instead that the comet’s coma deviates from an ideal state close to the nucleus, where a possible sublimation of dust grains is reported in the inner ~1000–2000 km of the coma. This contradiction is only an apparent one and can be easily explained. The amount of data points corresponding to the aforementioned zone close to the nucleus in the azimuthally averaged profiles is very low compared to the number of points describing the behavior at higher nucleocentric distances. The slopes therefore reflect the tendency of the outer coma, rather than that of its inner parts. The results from Sects. 4 and 5 point toward a common picture of a comet within the limits of a steady-state coma distorted by the solar radiation pressure except close to the nucleus, corresponding to few pixels on the images, where the nature of the emitted dust is likely changing.
6. Dust color maps
Additional information about the emitted dust can be derived from the analysis of its scattered colors. The parameter often used in cometary studies is the so-called normalized color, or reddening, measured in %/1000 Å (Jewitt & Meech 1986). This can be measured using the values of the intensity of the comet flux relative to the flux of the Sun in the different filter bands (e.g. Bonev et al. 2002), or, analogously, comparing the Afρ measures in the different filters (e.g. Lin et al. 2009).
We obtained two-dimensional color maps using our broadband-flux-calibrated images. In Fig. 6 we report a sample reddening image corresponding to 2010 February 9.
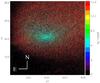 |
Fig. 6 Reddening map obtained using R and I calibrated images on February 9. The FoV is 50 000 km × 50 000 km. |
We found no clear evidence of different reddening values related to the structures found in Sect. 3 with respect to the surrounding coma within a single night. This implies that we observed dust with the same physical characteristics both in the structures and in the coma.
Values of the dust reddening were calculated averaging over the innermost 10 000 km of the coma to avoid effects of possible sky background residuals, as in Schulz et al. (2003), and they are shown in Table 3. Error estimates in the table are obtained from the propagation of the flux measures uncertainties. Although they appear to be large error bars, they have the same order of magnitude as found in previous analogous studies (e.g. Schulz et al. 2003; Farnham & Schleicher 2005).
Reddening values obtained from flux-calibrated R and I images, averaging the measures over the innermost 10 000 km of the coma.
Our February-June data give a moderately reddened dust, with a normalized color ~6–9%. These results are consistent with the average value of ~16% for cometary dust in the ultraviolet-green range (A’Hearn et al. 1995) and the evidence that the color changes progressively from red to neutral as the wavelength increases from the optical to the near-infrared (Jewitt & Meech 1986). Interestingly, we note that on July the value of the reddening is decreasing, reaching a negative value in August, and then increasing again in the September data. This behavior is clearly correlated to the measured increase of the activity, which appears to start already in July and peaks in August. The lowering of the reddening implies different scattering properties (i.e. a possible different nature) between the dust emitted during the second post-perihelion outburst episode and that released during the main activity of the comet. A possible explanation is that during July 81P started emitting small sub-micron particles that are brighter in R than in I and these particles optically dominated the inner coma contribution in August, possibly during their maximum release from the nucleus. After August the small particles were more effectively pushed away from the inner coma by the solar radiation pressure than bigger particles produced during the main activity and the reddening was increasing again, indicating that larger particles again started dominating the scattering behavior of the coma. Since the reddening value in September is only the half of that measured in the February-June period, we are probably still observing in our data a mixture of scattering effects from the small dust produced in July-August and bigger dust typical of the previous period. For the sake of completeness we have to admit that the reddening changes can be related to changes of other properties of the emitted dust rather than the size or size distribution, such as the composition or the morphology. Since we do not detect notable changes of the coma structures during the second outburst, we are inclined to think that the main activity source sampled in this event a section of the nucleus containing dust with different properties than that emitted during the first outburst and the usual activity. The evidence that the second post-perihelion increment of activity is related to a different kind of dust points toward the heterogeneity of 81P’s nucleus. We underline that a “bluening” of the dust color associated with outbursts was already observed in 1P/Halley (Womack et al. 1994) and C/1999 S4 Linear during its destruction (Bonev et al. 2002).
7. Comparison with previous perihelion passages
In this section we compare our measures with those present in the literature of previous perihelion passages, which allows us to discuss the secular evolution of the comet’s activity and its physical properties. For this purpose we considered the findings of A’Hearn et al. (1995), Fink & Hicks (1996), Hanner & Hayward (2003), Schulz et al. (2003), Sekanina (2003), Farnham & Schleicher (2005), and Hadamcik & Levasseur-Regourd (2009). A’Hearn et al. (1995) summarized the results of narrowband photometric data of 85 comets between 1976 and 1992. Fink & Hicks (1996) reported the analysis of 39 objects obtained from spectral measurements from 1985 to 1993. Hanner & Hayward (2003) observed 81P in the thermal infrared during 1997. Schulz et al. (2003) monitored the comet from 1996 to 1998 using broadband images and medium-resolution spectra. Sekanina (2003) composed visual magnitude data from the 1978, 1984, 1990, and 1997 apparitions. Farnham & Schleicher (2005) obtained narrowband images during 1978, 1984, 1997, and 2003/2004. Hadamcik & Levasseur-Regourd (2009) made a review on the optical properties of dust in JF comets.
7.1. Coma structures
Coma structures were already reported in the 1996/1997 perihelion passage by Schulz et al. (2003) and Farnham & Schleicher (2005). Schulz et al. (2003) observed a strong sunward fan and an anti-solar tail already in September–December 1996, a few months before the perihelion in May 1997. The fan maintained a constant appearance until April 1997. The comet’s activity increased approaching the closest distance to the Sun and other long-lasting sunward structures were measured. Their last data at rh = 3.162 AU in March 1998 showed no visible features except a faint tail.
Similar findings were presented in Farnham & Schleicher (2005). These authors also reported the sunward primary fan, which was characterized by small changes on monthly time scale starting from February 1997. An anti-solar tail was also visible. In July 1997 the intense fan was replaced by a new strong sunward jet. In September–October they found no well-defined structures besides an elongation of the coma isophotes. The constant appearance of the primary sunward fan in an inertial coordinate system over a monthly period suggested that it was being produced by a high-latitude source.
Our 2010 results described in Sect. 3 are consistent with the 1996/1997 scenario, likely indicating the same source of the comet’s main fan was active also during the last perihelion passage.
Unfortunately, during the Stardust close encounter in 2004 the sub-solar latitude was too far south to illuminate the source of the main fan, preventing us from testing its high-latitude location with in-situ data (Farnham 2009). It remains a challenging task anyway, relating the broad structures displayed in ground-based images to the many more intricate features observed by Stardust during the flyby (Brownlee et al. 2004; Sekanina et al. 2004).
7.2. Afρ and dust activity
A large set of Afρ values at different heliocentric distances was presented by Farnham & Schleicher (2005) for all previous perihelion passages. Unfortunately, these measurements were made in the ultraviolet, blue, and green spectral bands, preventing us from making a direct comparison with our data. The same problem was found with 1984 data by A’Hearn et al. (1995) because of their use of narrowband filters in the visible range. Schulz et al. (2003) were instead using a broadband R filter with an aperture radius of 10 000 km at the comet between the end of 1996 and the beginning of 1998. Their values prevalently refer to the pre-perihelion phase with only one post-perihelion measure at long heliocentric distance (406 cm at 3.126 AU). This value is notably much higher than our last finding in September at 2.42 AU from the Sun. Although limited to one single data set in the Afρ temporal evolution, this result points toward a 2010 perihelion passage less active, in terms of dust production, than that in 1997. For the sake of completeness, Sekanina (2003) found the comet equally bright in 1978, 1984, and 1997, but at least one magnitude fainter in 1990. The author speculated that the fading might be an effect of the perihelion distance increase between 1984 and 1990, although he admitted that the comet recovered its “usual” brightness in 1997. Since no orbital changes were involved between 1997 and 2010, the lower activity detected in 2010 in our measurements may indicate a natural aging of the object due to the continuous outgassing in its passages around the Sun.
A seasonal effect in which the dust production reached its maximum before perihelion was observed in 1990 and 1997 by Sekanina (2003), who measured a peak brightness around three weeks before perihelion. The author interpreted that behavior, together with a pre-perihelion brightening steeper than post-perihelion fading, as the result of a spin axis not quite normal to the orbital plane. Similar conclusions were reached using 1997 data by Farnham & Schleicher (2005). The authors identified the activity peaking 11–12 weeks before perihelion, probably due to the illumination conditions of the primary jet source. A natural explanation was that the early production peak and asymmetry in dust production are consequences of a strong seasonal effect with at least one source region moving rapidly from summer to winter. Analogously, Hanner & Hayward (2003) measured in 1997 that the comet’s activity was clearly higher at pre-perihelion, peaking near 50–55 days before it. Hadamcik & Levasseur-Regourd (2009, and references therein) also reported a peak dust production three to four weeks before the perihelion passages, taking into account all previous apparitions. These peaks were about the same for all apparitions. In summary, the pre-perihelion activity peak appears to be a seasonal effect characteristic of the comet after the injection into the present orbit. Our Afρ data, presenting a decreasing trend from February 2010 to the beginning of March, have to be interpreted as this seasonal effect also in the 2010 passage. The aforementioned authors did not measure any post-perihelion increments of the activity, as we found at the end of March–April and July–August. Post-perihelion outbursts appear therefore to be something new in the comet’s recent history.
7.3. Spatial profiles
Schulz et al. (2003) reported a trend toward flatter profiles with decreasing heliocentric distance in 1996–1998, which could be explained by the increasing fraction of gaseous emissions in the broadband filters. We observed no such tendency in our data. The measurements in 2010 are strongly affected by the two post-perihelion outbursts, which are steepening the spatial profiles, preventing us from measuring a possible dependence on the heliocentric distance. Nevertheless, all our profiles are within the limits for a steady-state coma distorted by solar radiation pressure, as in Schulz et al. (2003).
7.4. Dust colors
A uniform reddening over the coma, with color images not showing any distinct feature, was found by Schulz et al. (2003) throughout their observation run. This property indicated no obvious difference between the material of the structures and that of the general coma. We found this behavior consistent with our 2010 data.
Our color measures using R and I images during the main activity phase, i.e. outside the second outburst event, are consistent with the findings of Schulz et al. (2003) and Farnham & Schleicher (2005) in 1997. Schulz et al. (2003) measured an average color of 13.1 ± 3.0% over the innermost 10 000 km of the coma, using B, V, and R filters and 6.2 ± 5.0% from regions of clear continuum in the spectra. Farnham & Schleicher (2005) found a reddening of 36 ± 23% in the green-ultraviolet and 20 ± 10% in the green-blue ranges during the 1983/84 and 1997 apparitions. Moreover, the authors reported colors extracted from reflectance spectra obtained by Fink et al. (1999) in 1997 (9–16% between 5300 and 9800 Å).
All these findings point toward a moderately reddened dust in comet 81P, with a reddening that decreased while increasing the wavelength, in accordance with the typical behavior of comets (Jewitt & Meech 1986). This behavior was found independent of the heliocentric distance or the time from perihelion (Farnham & Schleicher 2005). Our measurements confirm that 81P’s dust shows similar colors along the different perihelion passages, independently of the heliocentric distance or time from perihelion.
8. Summary and conclusions
We observed the JF comet 81P/Wild 2, target of the NASA Stardust mission, from 2010 February 9 to September 9 in R and I broadband filters for a total of 11 nights.
The aims of the campaign were characterizing the comet’s dust activity during the 2010 perihelion passage and comparing this with previous apparitions to derive hints on the secular behavior of the object.
With image-enhancing techniques we found a long-lasting sunward fan, likely coming from the same activity source of the nucleus throughout our observations, and an anti-solar tail activity in all our data up to a heliocentric distance of 2.42 AU. The sunward activity has an almost constant projected position on a timescale of months without clear evidence of rotational modulation.
The Afρ measurements indicate a pre-perihelion peak of the activity caused by seasonal effects and two post-perihelion outbursts.
The spatial profile analysis shows the steepening of the profiles in correspondences with the two outburst, preventing us from investigating a possible dependance on the heliocentric distance. Both the spatial and the Afρ radial profiles analysis point toward a steady-state coma, distorted by solar radiation pressure, at nucleocentric distances greater than ~1000–2000 km. Close to the nucleus there is evidence of processes such as sublimation of grains, which modifies the nature of the emitted dust.
The color investigation reveals a moderately reddened dust with a 6–9% reddening, consistent with the current picture of cometary dust and previous measurements of the object at different wavelength ranges. We found that the second post-perihelion outburst is connected with the emission of dust characterized by significantly lower reddening values. This likely indicates that different internal sections of the nucleus were involved in the event compared with those producing the main activity, pointing toward an heterogeneous object.
Consistencies between our 2010 findings and the presence of coma structures, measurements of radial profiles, and colors in previous perihelion passages point toward a picture where the recurrent main activity in the comet is always driven by the same areas on the nucleus surface during the various apparitions.
The comparison between our last Afρ measure at rh = 2.42 AU and similar broadband R data from 1998 suggests that the comet was less productive in 2010, pointing toward a possible secular aging of the object and its activity.
Acknowledgments
We are grateful to all the service observers of the Instituto de Astrofisica de Canarias working at the Roque de los Muchachos and Teide Observatories. Without their engagement, disponibily, and dedication this program would not have been successful. Special thanks go to Alex Oscoz Abad, Rafael Barrena Delgado, Pilar Montañes Rodriguez, Cristina Zurita Espinosa, and Jorge Garcia Rojas for their constant support during the observations. The authors are grateful to the anonymous referee, who greatly helped improving the quality of the paper.
References
- A’Hearn, M. F., Schleicher, D. G., Millis, R. L., Feldman, P. D., & Thompson, D. T. 1984, AJ, 89, 579 [NASA ADS] [CrossRef] [Google Scholar]
- A’Hearn, M. F., Millis, R. L., Schleicher, D. G., Osip, D. J., & Birch, P. V. 1995, Icarus, 118, 223 [NASA ADS] [CrossRef] [Google Scholar]
- Bertini, I., Thomas, N., & Barbieri, C. 2007, A&A, 461, 351 [NASA ADS] [CrossRef] [EDP Sciences] [Google Scholar]
- Bertini, I., Lara, L. M., Vincent, J., et al. 2009, A&A, 496, 235 [NASA ADS] [CrossRef] [EDP Sciences] [Google Scholar]
- Bockelée-Morvan, D., Gautier, D., Hersant, F., Huré, J.-M., & Robert, F. 2002, A&A, 384, 1107 [NASA ADS] [CrossRef] [EDP Sciences] [Google Scholar]
- Boehnhardt, H., & Birkle, K. 1994, A&AS, 107, 101 [NASA ADS] [Google Scholar]
- Bonev, T., Jockers, K., Petrova, E., et al. 2002, Icarus, 160, 419 [NASA ADS] [CrossRef] [Google Scholar]
- Bonev, T., Boehnhardt, H., & Borisov, G. 2008, A&A, 480, 277 [NASA ADS] [CrossRef] [EDP Sciences] [Google Scholar]
- Boss, A. P. 2008, Earth Planet. Sci. Lett., 268, 102 [NASA ADS] [CrossRef] [Google Scholar]
- Brownlee, D. E., Horz, F., Newburn, R. L., et al. 2004, Science, 304, 1764 [NASA ADS] [CrossRef] [PubMed] [Google Scholar]
- Brownlee, D., Tsou, P., Aléon, J., et al. 2006, Science, 314, 1711 [NASA ADS] [CrossRef] [PubMed] [Google Scholar]
- Burchell, M. J., & Kearsley, A. T. 2009, Planet. Space Sci., 57, 1146 [NASA ADS] [CrossRef] [Google Scholar]
- Burlov-Vasiljev, K. A., Gurtovenko, E. A., & Matvejev, Y. B. 1995, Sol. Phys., 157, 51 [Google Scholar]
- Burlov-Vasiljev, K. A., Matvejev, Y. B., & Vasiljeva, I. E. 1998, Sol. Phys., 177, 25 [NASA ADS] [CrossRef] [Google Scholar]
- Burnett, D. S. 2006, Science, 314, 1709 [NASA ADS] [CrossRef] [Google Scholar]
- Eddington, A. S. 1910, MNRAS, 70, 442 [NASA ADS] [Google Scholar]
- Epifani, E., Colangeli, L., Fulle, M., et al. 2001, Icarus, 149, 339 [NASA ADS] [CrossRef] [Google Scholar]
- Farnham, T. L. 2009, Planet. Space Sci., 57, 1192 [NASA ADS] [CrossRef] [Google Scholar]
- Farnham, T. L., & Schleicher, D. G. 2005, Icarus, 173, 533 [NASA ADS] [CrossRef] [Google Scholar]
- Ferrín, I. 2007, Icarus, 191, 22 [NASA ADS] [CrossRef] [Google Scholar]
- Fink, U., & Hicks, M. D. 1996, ApJ, 459, 729 [NASA ADS] [CrossRef] [Google Scholar]
- Fink, U., Hicks, M. P., & Fevig, R. A. 1999, Icarus, 141, 331 [NASA ADS] [CrossRef] [Google Scholar]
- Fulle, M. 2000, Icarus, 145, 239 [NASA ADS] [CrossRef] [Google Scholar]
- Fulle, M., Mikuz, H., & Bosio, S. 1997, A&A, 324, 1197 [NASA ADS] [Google Scholar]
- Fulle, M., Levasseur-Regourd, A. C., McBride, N., & Hadamcik, E. 2000, AJ, 119, 1968 [Google Scholar]
- Hadamcik, E., & Levasseur-Regourd, A. C. 2009, Planet. Space Sci., 57, 1118 [NASA ADS] [CrossRef] [Google Scholar]
- Hanner, M. S., & Hayward, T. L. 2003, Icarus, 161, 164 [NASA ADS] [CrossRef] [Google Scholar]
- Ishiguro, M., Kwon, S. M., Sarugaku, Y., et al. 2003, ApJ, 589, L101 [NASA ADS] [CrossRef] [Google Scholar]
- Jewitt, D., & Meech, K. J. 1986, ApJ, 310, 937 [NASA ADS] [CrossRef] [Google Scholar]
- Jewitt, D. C., & Meech, K. J. 1987, ApJ, 317, 992 [NASA ADS] [CrossRef] [Google Scholar]
- Keller, H. U., Küppers, M., Fornasier, S., et al. 2007, Icarus, 187, 87 [NASA ADS] [CrossRef] [Google Scholar]
- Landolt, A. U. 2009, AJ, 137, 4186 [NASA ADS] [CrossRef] [Google Scholar]
- Lara, L.-M., Tozzi, G. P., Boehnhardt, H., DiMartino, M., & Schulz, R. 2004, A&A, 422, 717 [NASA ADS] [CrossRef] [EDP Sciences] [Google Scholar]
- Lara, L. M., Lin, Z.-Y., Rodrigo, R., & Ip, W.-H. 2011, A&A, 525, A36 [NASA ADS] [CrossRef] [EDP Sciences] [Google Scholar]
- Larson, S. M., & Sekanina, Z. 1984, AJ, 89, 571 [NASA ADS] [CrossRef] [Google Scholar]
- Lin, Z., Lin, C., Ip, W., & Lara, L. M. 2009, AJ, 138, 625 [NASA ADS] [CrossRef] [Google Scholar]
- Lin, Z., Lara, L. M., & Ip, W. 2010, in EPSC 2010 Program Book, 49 [Google Scholar]
- Mäkinen, J. T. T., Silén, J., Schmidt, W., et al. 2001, Icarus, 152, 268 [NASA ADS] [CrossRef] [Google Scholar]
- Nakamura, T., Watanabe, J., & Kawakami, H. 1991, Earth Moon and Planets, 52, 15 [NASA ADS] [CrossRef] [Google Scholar]
- Palmer, J., & Davenhall, A. C. 2001, The CCD Photometric Calibration Cookbook, Starlink Cookbook 6.4 [Google Scholar]
- Price, M. C., Kearsley, A. T., Burchell, M. J., et al. 2010, Met. Planet. Sci., 45, 1409 [Google Scholar]
- Schulz, R., Stüwe, J. A., Boehnhardt, H., Gaessler, W., & Tozzi, G. P. 2003, A&A, 398, 345 [NASA ADS] [CrossRef] [EDP Sciences] [Google Scholar]
- Sekanina, Z. 2003, J. Geophys. Res. (Planets), 108, 8112 [NASA ADS] [CrossRef] [Google Scholar]
- Sekanina, Z., & Yeomans, D. K. 1985, AJ, 90, 2335 [NASA ADS] [CrossRef] [Google Scholar]
- Sekanina, Z., Brownlee, D. E., Economou, T. E., Tuzzolino, A. J., & Green, S. F. 2004, Science, 304, 1769 [NASA ADS] [CrossRef] [PubMed] [Google Scholar]
- Tozzi, G. P., & Licandro, J. 2002, Icarus, 157, 187 [NASA ADS] [CrossRef] [Google Scholar]
- Tozzi, G. P., Lara, L. M., Kolokolova, L., et al. 2004, A&A, 424, 325 [NASA ADS] [CrossRef] [EDP Sciences] [Google Scholar]
- Tozzi, G. P., Boehnhardt, H., Kolokolova, L., et al. 2007, A&A, 476, 979 [NASA ADS] [CrossRef] [EDP Sciences] [Google Scholar]
- Tozzi, G. P., Patriarchi, P., Boehnhardt, H., et al. 2011, A&A, 531, A54 [NASA ADS] [CrossRef] [EDP Sciences] [Google Scholar]
- Vincent, J. B. 2010, Ph.D. Thesis, University of Braunschweig [Google Scholar]
- Vsekhsvyatskii, S. K. 1963, SvA, 6, 849 [NASA ADS] [Google Scholar]
- Wallace, L. V., Miller, I., & Freeman, D. 1958, AJ, 63, 213 [NASA ADS] [CrossRef] [Google Scholar]
- Westphal, A. J., Fakra, S. C., Gainsforth, Z., et al. 2009, ApJ, 694, 18 [NASA ADS] [CrossRef] [Google Scholar]
- Wild, P., & Marsden, B. G. 1978, IAU Circ., 3167, 3 [NASA ADS] [Google Scholar]
- Womack, M., Lutz, B. L., & Wagner, R. M. 1994, ApJ, 433, 886 [NASA ADS] [CrossRef] [Google Scholar]
- Woodward, C. E., Jones, T. J., Brown, B., et al. 2011, AJ, 141, 181 [NASA ADS] [CrossRef] [Google Scholar]
All Tables
Reddening values obtained from flux-calibrated R and I images, averaging the measures over the innermost 10 000 km of the coma.
All Figures
|
Fig. 1 Coma structures found at different dates from R-band data with image-enhancing techniques. First, second, third, and fourth column shows an isophotal representation of the corresponding original image, Larson-Sekanina and adaptive Laplace filtering results, and a large field of view Larson-Sekanina frame to show the curvature of the sunward dust activity at long nucleocentric distances, respectively. The Laplace filter width used was 15 px on 2010 February 9 and 23 px on all other dates. All images are oriented north-up, east-left. Arrows pointing S give the position of the Sun in the frames. The horizontal bar in the upper right corners corresponds to a scale length of 10 000 km. |
| In the text | |
|
Fig. 2 Afρ versus the nucleocentric distance ρ during 2010 February 9 and July 3. Continuous and dashed lines represent data taken in R and I bands, respectively. |
| In the text | |
|
Fig. 3 Afρ versus the days from perihelion date measured at the nucleocentric distance of 10 000 km in R-band data. Black dots represent the original A(α)fρ values without phase-effect correction. Red triangles (a), rhombuses (b), and squares (c) are the reduced A(0)fρ values considering a pure silicate, pure organic, and mixed composition, respectively. The error bars are derived from the 10% uncertainty in the Afρ measurements. The two arrows in (a) mark the Afρ measurements during the two post-perihelion outburst events. |
| In the text | |
|
Fig. 4 R-band 81P absolute magnitude, H10, versus the days from perihelion date. The two arrows mark the H10 measurements during the two post-perihelion outburst events. |
| In the text | |
|
Fig. 5 Values of the log(B) vs. log(ρ) slope, m, versus the days from perihelion for R-band observations. The standard deviation of these fits is always <1%. |
| In the text | |
|
Fig. 6 Reddening map obtained using R and I calibrated images on February 9. The FoV is 50 000 km × 50 000 km. |
| In the text | |
Current usage metrics show cumulative count of Article Views (full-text article views including HTML views, PDF and ePub downloads, according to the available data) and Abstracts Views on Vision4Press platform.
Data correspond to usage on the plateform after 2015. The current usage metrics is available 48-96 hours after online publication and is updated daily on week days.
Initial download of the metrics may take a while.