Fig. 3
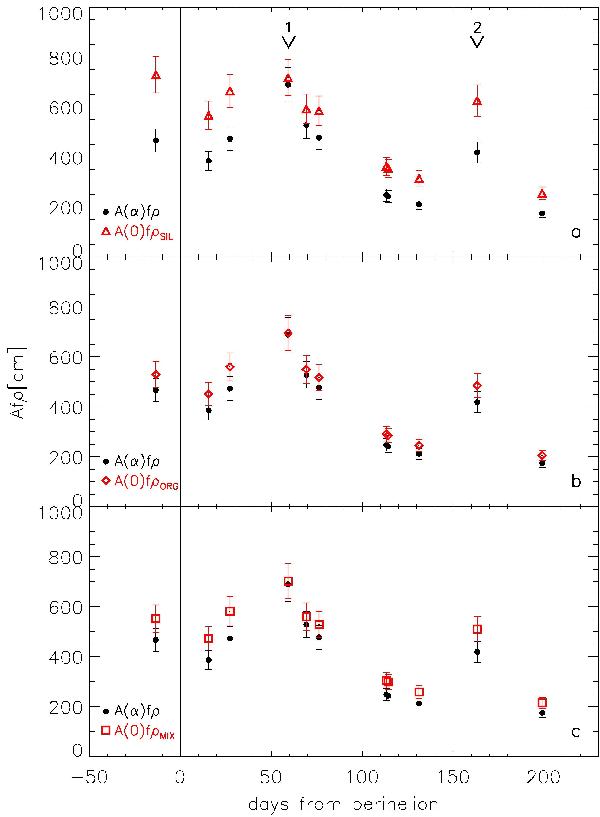
Afρ versus the days from perihelion date measured at the nucleocentric distance of 10 000 km in R-band data. Black dots represent the original A(α)fρ values without phase-effect correction. Red triangles (a), rhombuses (b), and squares (c) are the reduced A(0)fρ values considering a pure silicate, pure organic, and mixed composition, respectively. The error bars are derived from the 10% uncertainty in the Afρ measurements. The two arrows in (a) mark the Afρ measurements during the two post-perihelion outburst events.
Current usage metrics show cumulative count of Article Views (full-text article views including HTML views, PDF and ePub downloads, according to the available data) and Abstracts Views on Vision4Press platform.
Data correspond to usage on the plateform after 2015. The current usage metrics is available 48-96 hours after online publication and is updated daily on week days.
Initial download of the metrics may take a while.