Fig. 2
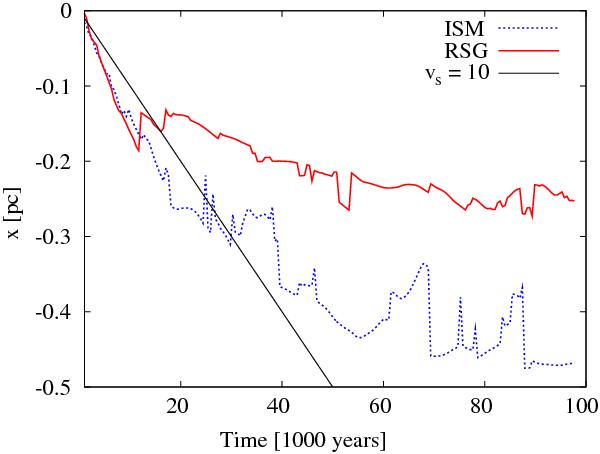
Position of the shock along the x axis (defined by the point with maximum temperature) as a function of time for the ISM (dashed line) and the stellar wind (dotted line). The black solid line demonstrates the trajectory for a vs = 10 km s-1 shock velocity. All velocities are measured with respect to the stationary frame of the star.
Current usage metrics show cumulative count of Article Views (full-text article views including HTML views, PDF and ePub downloads, according to the available data) and Abstracts Views on Vision4Press platform.
Data correspond to usage on the plateform after 2015. The current usage metrics is available 48-96 hours after online publication and is updated daily on week days.
Initial download of the metrics may take a while.