Free Access
Fig. 16
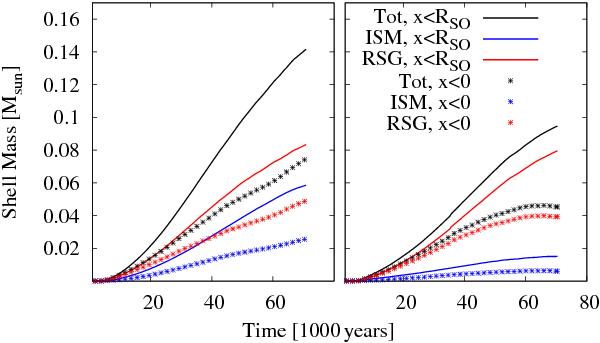
Evolution of the bow shock shell mass for models B (left) and D (right). For both models, the RSG and ISM contributions are in red and blue, respectively, and their combined mass is plotted in black. The solid lines trace mass for x < RSO, while the points trace x < 0 gas.
Current usage metrics show cumulative count of Article Views (full-text article views including HTML views, PDF and ePub downloads, according to the available data) and Abstracts Views on Vision4Press platform.
Data correspond to usage on the plateform after 2015. The current usage metrics is available 48-96 hours after online publication and is updated daily on week days.
Initial download of the metrics may take a while.