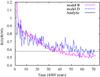
Fig. 11
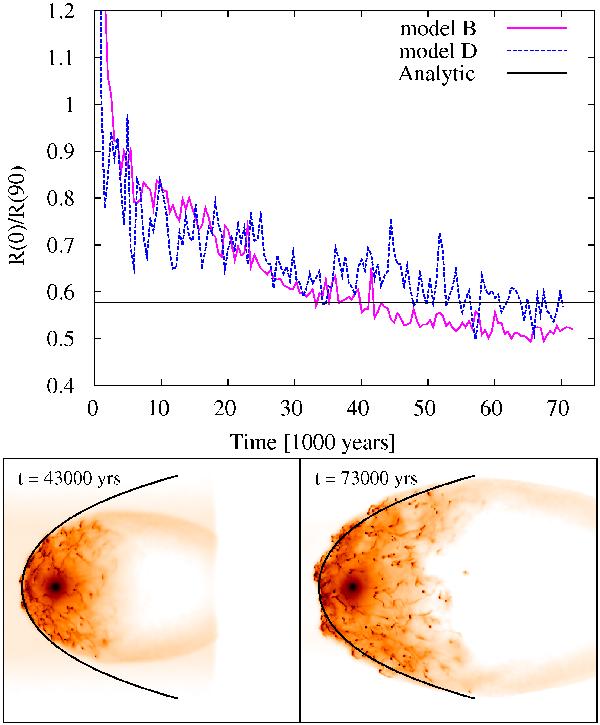
Top: ratio of R(0°)/R(90°) as a function of time for models B (magenta) and D (blue) compared to the analytic value in black. Bottom: hydrogen column density (on a logarithmic scale) for model B after 43 000 years (left) and 73 000 years (right). The analytic solution for the shape of the bow shock, given by Eq. (4), is shown in black 2.
Current usage metrics show cumulative count of Article Views (full-text article views including HTML views, PDF and ePub downloads, according to the available data) and Abstracts Views on Vision4Press platform.
Data correspond to usage on the plateform after 2015. The current usage metrics is available 48-96 hours after online publication and is updated daily on week days.
Initial download of the metrics may take a while.