Fig. 1
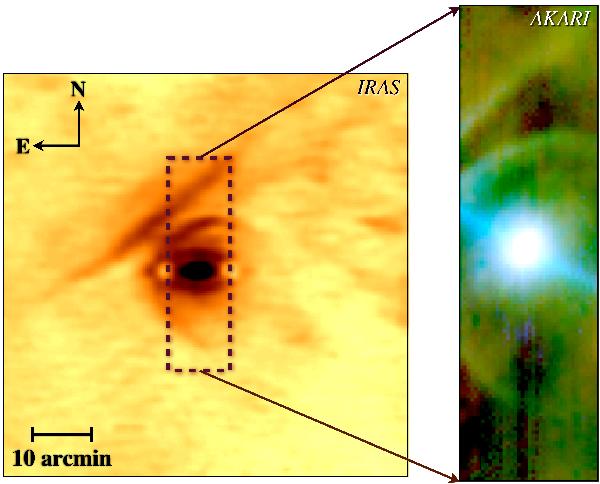
Bow shock and “bar” of Betelgeuse. Left. The 60 μm IRAS observation retrieved from the IRAS Galaxy Atlas (IGA) Image Server1 (for details about IGA, see Cao et al. 1997). Right. The high-resolution, composite AKARI image with 65 μm, 90 μm, and 140 μm emission in blue, green, and red, respectively (Ueta et al. 2008) [Credit: AKARI MLHES team].
Current usage metrics show cumulative count of Article Views (full-text article views including HTML views, PDF and ePub downloads, according to the available data) and Abstracts Views on Vision4Press platform.
Data correspond to usage on the plateform after 2015. The current usage metrics is available 48-96 hours after online publication and is updated daily on week days.
Initial download of the metrics may take a while.