Fig. 1
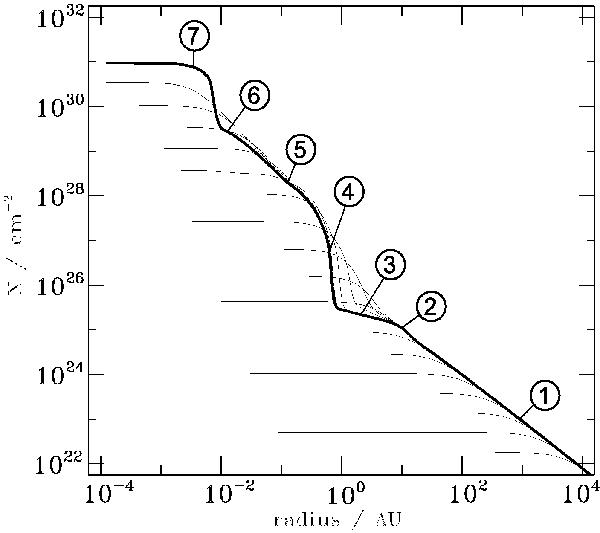
Column number density profile versus radius for Model 2. The thin lines (in ascending order) are plots at the times listed in Table 2. Several features are identifiable via their associated breaks in the profile. (1) Prestellar infall profile with N ∝ r-1. (2) Magnetic wall at ≈10 AU, where the bunched-up field lines decelerate material before it continues the infall. (3) Expansion wave profile with N ∝ r−1/2 outside the first core. (4) First core at 1 AU. (5) Infall profile onto the second core with N ∝ r-1. After the first core has reached ≈1000 K, it starts to collapse, as H2 is dissociated. (6) Expansion wave profile with N ∝ r−1/2 outside the second core. (7) Second core at ≈1 R⊙.
Current usage metrics show cumulative count of Article Views (full-text article views including HTML views, PDF and ePub downloads, according to the available data) and Abstracts Views on Vision4Press platform.
Data correspond to usage on the plateform after 2015. The current usage metrics is available 48-96 hours after online publication and is updated daily on week days.
Initial download of the metrics may take a while.