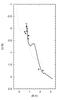
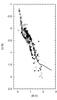
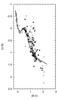
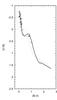
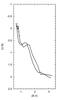
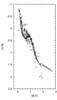
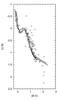
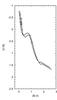
Fig. A.3

Top: reddened ZAMS fitting to the cluster members with P% > Pmin (open circles). The position of the other stars of the sample is indicated by crosses. A full line shows the curve obtained with the fitting algorithm, while the dotted line shows the intrinsic U − B and B − V colours. Bottom: curves representing the limit ΔE(B − V) = 0.11 suggested by Burki (1975). From left to right: Berkeley 86, NGC 2244, NGC 2264, and NGC 6530.
Current usage metrics show cumulative count of Article Views (full-text article views including HTML views, PDF and ePub downloads, according to the available data) and Abstracts Views on Vision4Press platform.
Data correspond to usage on the plateform after 2015. The current usage metrics is available 48-96 hours after online publication and is updated daily on week days.
Initial download of the metrics may take a while.