Fig. 3
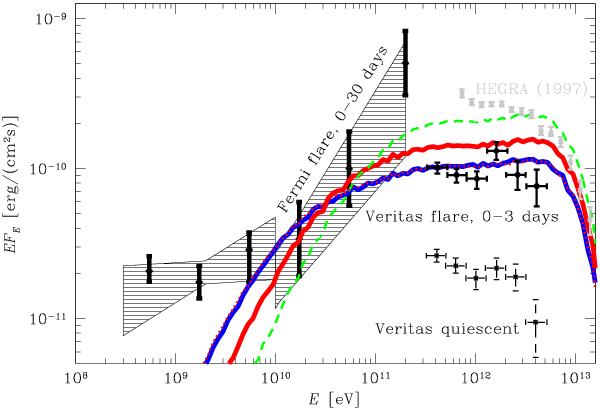
Fermi spectrum of Mrk 501 for the 30 day period during the flare (shared area, 68% confidence level of normalization and slope of the spectrum). Data points in the TeV band show VERITAS measurements (Abdo et al. 2011) of the spectrum during the first 3 days of the flare (solid lines) and in the quiescent state (dashed lines). Model curves show emission from electromagnetic cascade initiated by 100 TeV γ-rays in the intergalactic medium. The solid thick red curve is for intergalactic magnetic field 3 × 10-17 G with a correlation length of 1 Mpc. Dashed curves are for B = 10-16 G (upper curve) and B = 10-17 G (lower curve). Grey data points show the spectrum of the historically brightest source state in 1997 measured by CAT telescope (Aharonian et al. 1996).
Current usage metrics show cumulative count of Article Views (full-text article views including HTML views, PDF and ePub downloads, according to the available data) and Abstracts Views on Vision4Press platform.
Data correspond to usage on the plateform after 2015. The current usage metrics is available 48-96 hours after online publication and is updated daily on week days.
Initial download of the metrics may take a while.