Fig. 6
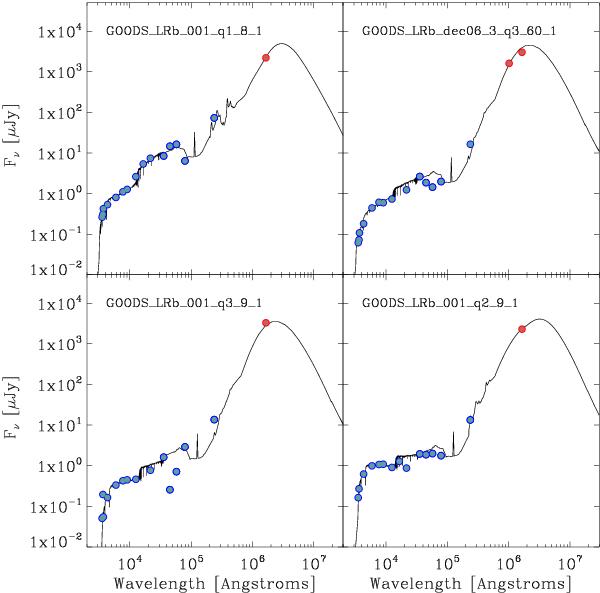
Optical-to-FIR observed SED of the PACS-detected Lymanα emitting galaxies. Blue dots represent the multi-wavelength photometry from U-band to MIPS-24 μm, and red dots are the PACS-100 μm and/or PACS-160 μm fluxes. The black curve represents the combination of BC03 and CE01 templates that best fit the photometric data for each galaxy.
Current usage metrics show cumulative count of Article Views (full-text article views including HTML views, PDF and ePub downloads, according to the available data) and Abstracts Views on Vision4Press platform.
Data correspond to usage on the plateform after 2015. The current usage metrics is available 48-96 hours after online publication and is updated daily on week days.
Initial download of the metrics may take a while.