Fig. 4
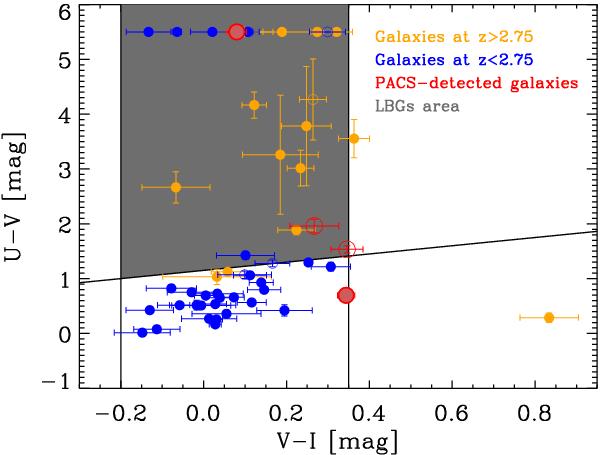
Colour–colour diagram containing the locus of LBGs according to Pentericci et al. (2010). Filled and open dots represent LAEs and non-LAEs, respectively. Orange and blue dots represent galaxies at z > 2.75 and z < 2.75, respectively. Red dots are PACS-detected galaxies and shaded zone is the area where LBGs are located. For clarity, the galaxies with a U − V colour greater than 5.5 are assigned U − V = 5.5.
Current usage metrics show cumulative count of Article Views (full-text article views including HTML views, PDF and ePub downloads, according to the available data) and Abstracts Views on Vision4Press platform.
Data correspond to usage on the plateform after 2015. The current usage metrics is available 48-96 hours after online publication and is updated daily on week days.
Initial download of the metrics may take a while.