Free Access
Fig. 3
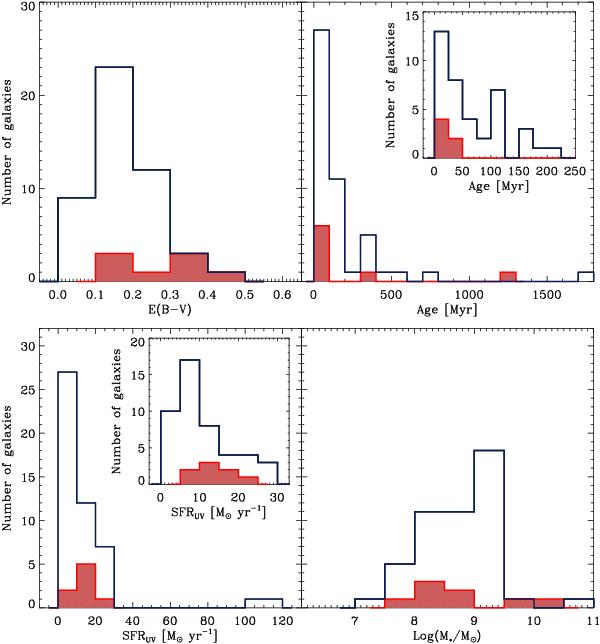
Distribution of the physical properties for the sample of 56 LAEs. Blue- and red-shaded histograms represent LAEs and non-LAEs, respectively. Inset plots are more detailed representations of the zones of the histograms where most objects are located.
Current usage metrics show cumulative count of Article Views (full-text article views including HTML views, PDF and ePub downloads, according to the available data) and Abstracts Views on Vision4Press platform.
Data correspond to usage on the plateform after 2015. The current usage metrics is available 48-96 hours after online publication and is updated daily on week days.
Initial download of the metrics may take a while.