Fig. 5
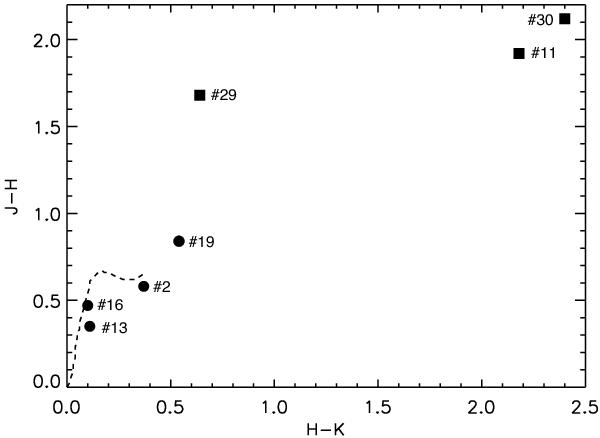
Approximate 2MASS colours for possible near-infrared counterparts of detected sources in our sample (magnitudes are not corrected for extinction). Circles represent sources that also have optical information, whereas squares indicate objects that are only detected in the infrared bands. The data points are labelled to indicate the corresponding source numbers (see Table 6). The dashed line indicates the expectation for A- through M-type main-sequence stars. Correcting for extinction would move the data points down and towards the left in this diagram.
Current usage metrics show cumulative count of Article Views (full-text article views including HTML views, PDF and ePub downloads, according to the available data) and Abstracts Views on Vision4Press platform.
Data correspond to usage on the plateform after 2015. The current usage metrics is available 48-96 hours after online publication and is updated daily on week days.
Initial download of the metrics may take a while.