Fig. 5
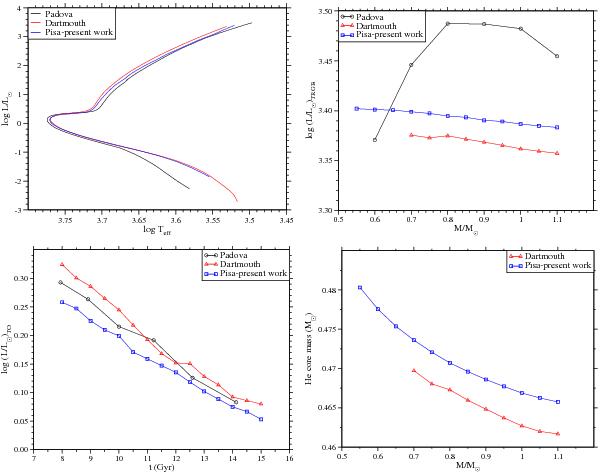
Comparison at Z = 0.008, Y = 0.33 and αml = 1.90 among the different databases of Table 3. For the STEV database, we selected Y = 0.34 and αml = 1.68 as the values among those available that are closest to those of the other databases. The tracks of the Dartmouth databases were interpolated in Z, see text. Upper left panel: theoretical isochrones at t = 12.5 Gyr. Upper right panel: red giant branch tip luminosity. Lower left panel: turn-off luminosity. Lower right panel: helium core mass at the He flash.

Current usage metrics show cumulative count of Article Views (full-text article views including HTML views, PDF and ePub downloads, according to the available data) and Abstracts Views on Vision4Press platform.
Data correspond to usage on the plateform after 2015. The current usage metrics is available 48-96 hours after online publication and is updated daily on week days.
Initial download of the metrics may take a while.