Fig. 1
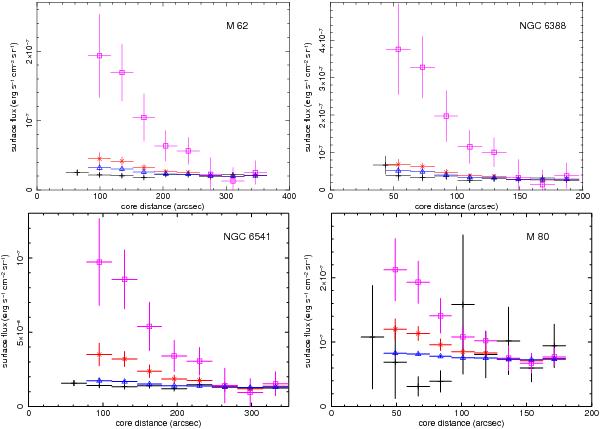
Radial dependence of the surface flux (1–7 keV) above the NXB for four of the six GCs considered in this study (as labeled in the individual figures). The different colors and markers show the measured surface flux (crosses, black) and the predictions based on an IC model (squares, magenta), a model assuming the same luminosity as Terzan 5 (stars, red) and a model assuming a connection to msPSRs (triangles, blue). The drawn uncertainties are the same as given in Table 3.
Current usage metrics show cumulative count of Article Views (full-text article views including HTML views, PDF and ePub downloads, according to the available data) and Abstracts Views on Vision4Press platform.
Data correspond to usage on the plateform after 2015. The current usage metrics is available 48-96 hours after online publication and is updated daily on week days.
Initial download of the metrics may take a while.