Fig. 2
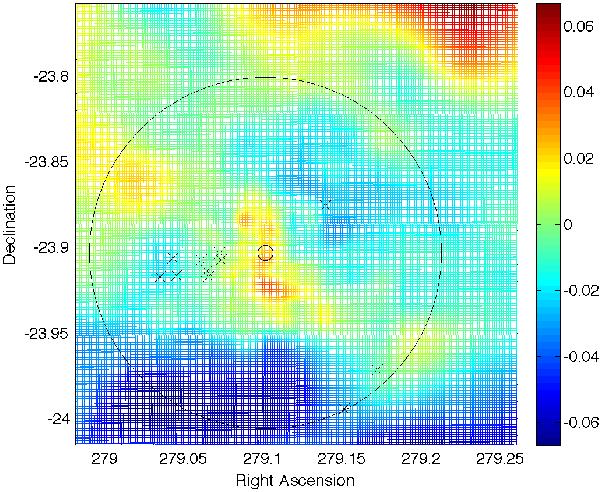
Extinction map for M 22 in equatorial coordinates (J2000). The small and large circles indicate, respectively, the GC’s center and the area where the program stars (crosses) lie in the GC’s field. The color bar gives the excesses E(B − V) for the extinction map. The zero point is arbitrary and it is calculated by comparison with isochrones (see Alonso-Garcia et al. 2011, 2012, for more details on the techniques and methods used to create this figure). The orientation is different from Fig. 1 (North-East points to the upper right corner).
Current usage metrics show cumulative count of Article Views (full-text article views including HTML views, PDF and ePub downloads, according to the available data) and Abstracts Views on Vision4Press platform.
Data correspond to usage on the plateform after 2015. The current usage metrics is available 48-96 hours after online publication and is updated daily on week days.
Initial download of the metrics may take a while.