Free Access
Fig. 3
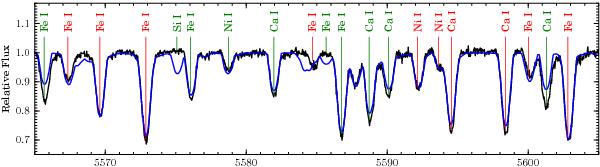
40 Å region centred at 5585 Å of the disentangled spectrum for the primary component of EF Aqr (black) and a matching synthetic spectrum calculated with VWA (blue). The lines indicated in green are used in the abundance determinations.
Current usage metrics show cumulative count of Article Views (full-text article views including HTML views, PDF and ePub downloads, according to the available data) and Abstracts Views on Vision4Press platform.
Data correspond to usage on the plateform after 2015. The current usage metrics is available 48-96 hours after online publication and is updated daily on week days.
Initial download of the metrics may take a while.