Fig. 5
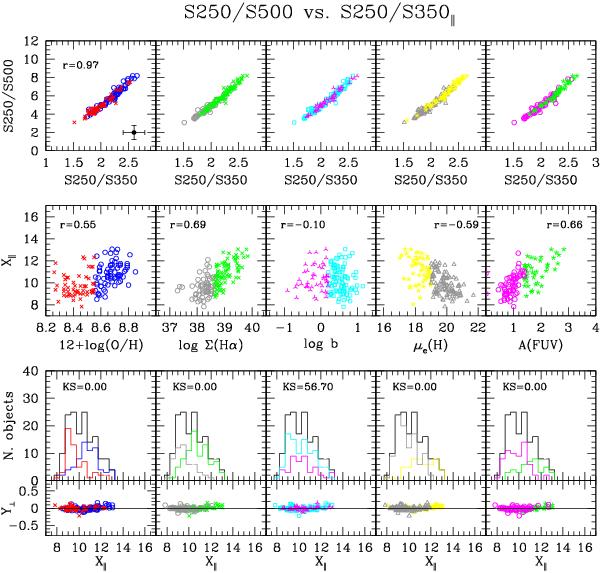
Upper panel: the S250/S500 vs. S250/S350 colour–colour relation with galaxies coded according to their physical parameters as in Fig. 4. Middle panel: the dependence of the position of galaxies along the S250/S500 vs. S250/S350 colour–colour relation (X∥) on the different physical parameters. Lower panel: the histogram of the distribution of galaxies along the colour–colour relation (upper) and the relation between the position of galaxies in the direction perpendicular (Y⊥) and that along (X∥) the colour–colour relation. The de-projection of the S250/S500 vs. S250/S350 colour–colour relation is done using the measured linear best fit: S250/S500 = 4.78( ± 0.09) × S250/S350 – 4.59( ± 0.19); r = 0.97.
Current usage metrics show cumulative count of Article Views (full-text article views including HTML views, PDF and ePub downloads, according to the available data) and Abstracts Views on Vision4Press platform.
Data correspond to usage on the plateform after 2015. The current usage metrics is available 48-96 hours after online publication and is updated daily on week days.
Initial download of the metrics may take a while.