Fig. 4
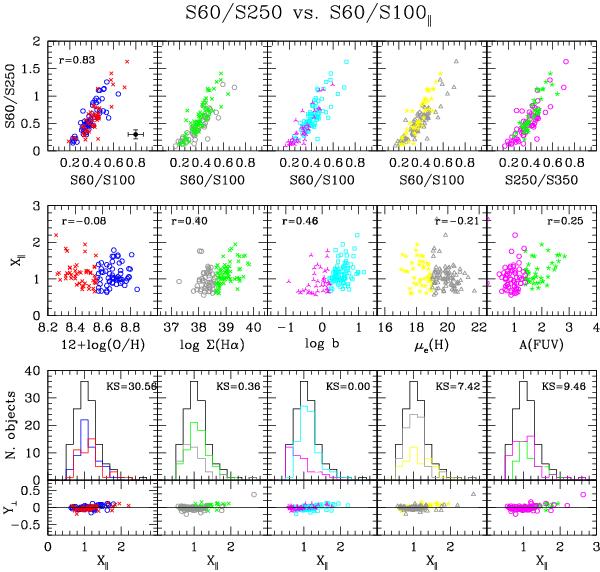
Upper panel: the S60/S250 vs. S60/S100 colour–colour relation with galaxies coded according to their physical parameters (from left to right) as a function of the metallicity (red crosses for 12 + log(O/H) ≤ 8.55, blue circles for 12 + log (O/H) > 8.55), Hα surface brightness (grey circles for log Σ(Hα) ≤ 38.6 erg s-1 kpc-2, green crosses for log Σ(Hα) > 38.6 erg s-1 kpc-2), birthrate parameter (magenta three points stars for log b ≤ 0.2, cyan squares for log b > 0.2), H band effective surface brightness (yellow stars for μe(H) ≤ 19 AB mag arcsec-2, grey triangles for μe(H) > 19 AB mag arcsec-2) and UV attenuation (magenta circles for A(FUV) < 1.4 mag, green stars for A(FUV) ≥ 1.4). Middle panel: the dependence of the position of galaxies along the S60/S250 vs. S60/S100 colour–colour relation (X∥) on the different physical parameters. Lower panel: the histogram of the distribution of galaxies along the colour–colour relation (upper) and the relation between the position of galaxies in the direction perpendicular (Y⊥) and that along (X∥) the colour–colour relation. r gives the Spearman correlation coefficient of the different relations, KS the probability that the two galaxy populations are driven by the same parent population (Kolmogorov-Smirnov test: for KS ≤ 5 the two galaxy populations are statistically different). The de-projection of the S60/S100 vs. S60/S250 colour–colour relation is done using the measured linear best fit: S60/S250 = 2.64( ± 0.16) × S60/S100 – 0.45(±0.06); r = 0.83.
Current usage metrics show cumulative count of Article Views (full-text article views including HTML views, PDF and ePub downloads, according to the available data) and Abstracts Views on Vision4Press platform.
Data correspond to usage on the plateform after 2015. The current usage metrics is available 48-96 hours after online publication and is updated daily on week days.
Initial download of the metrics may take a while.