Fig. 1
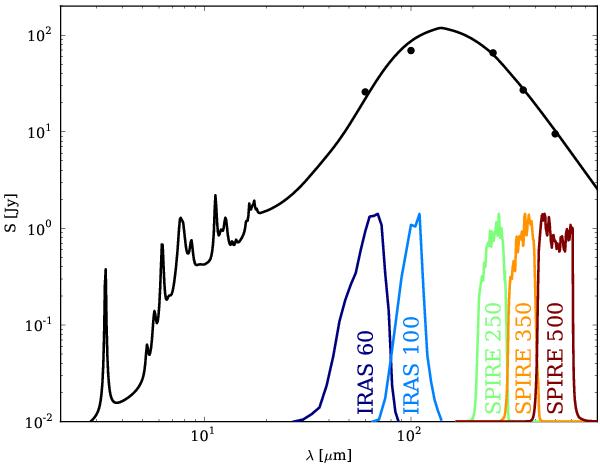
The infrared (2–800 μm) spectral energy distribution of the spiral galaxy M100 (NGC 4321). The solid line is, among the Draine & Li (2007) dust models, the one better fitting the observed data (filled dots). The IRAS 60 and 100 μm bands sample the dust emitting at wavelengths shorter than the wavelength of the peak (~150 μm) and are thus sensitive to the emission of the warm dust. The SPIRE bands at 250, 350 and 500 μm cover the Rayleigh-Jeans tail of the dust emission (cold dust).
Current usage metrics show cumulative count of Article Views (full-text article views including HTML views, PDF and ePub downloads, according to the available data) and Abstracts Views on Vision4Press platform.
Data correspond to usage on the plateform after 2015. The current usage metrics is available 48-96 hours after online publication and is updated daily on week days.
Initial download of the metrics may take a while.