Fig. 3
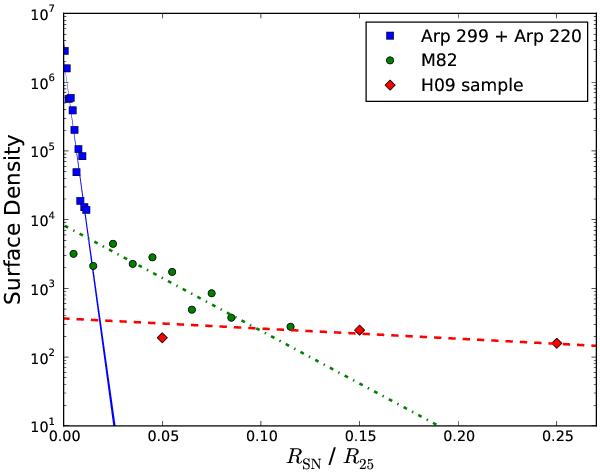
Radial distribution of SNe for (nuclear) starbursts and spiral galaxies. The data correspond to the combined Arp 299-A + Arp 220 sample (blue squares), M 82 (green circles), and the H09 sample of spiral galaxies (red diamonds), and the fitted lines are for Arp 299-A + Arp 220 (solid line), M 82 (dotted-dashed line), and H09 (dashed line). For the sake of clarity, only the innermost part of the H09 sample is shown in the plot.
Current usage metrics show cumulative count of Article Views (full-text article views including HTML views, PDF and ePub downloads, according to the available data) and Abstracts Views on Vision4Press platform.
Data correspond to usage on the plateform after 2015. The current usage metrics is available 48-96 hours after online publication and is updated daily on week days.
Initial download of the metrics may take a while.