Fig. 2
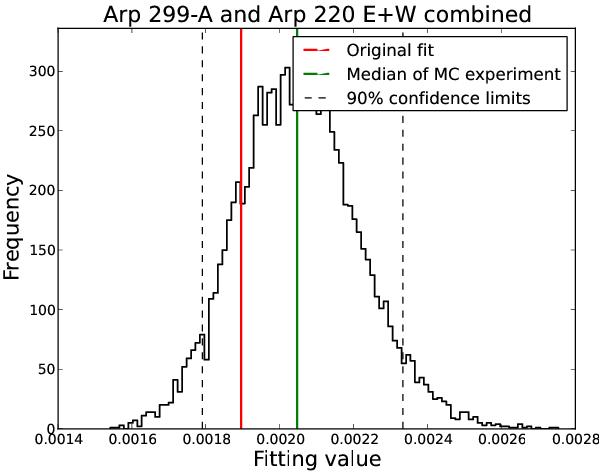
MC histogram of  for the combined sample of SNe from Arp 299-A and the two nuclei of Arp 220. The
original non-linear fit is shown in red, and the median of the distribution
created with the MC simulation is shown in green. The dashed lines correspond to
the 90% confidence level interval.
for the combined sample of SNe from Arp 299-A and the two nuclei of Arp 220. The
original non-linear fit is shown in red, and the median of the distribution
created with the MC simulation is shown in green. The dashed lines correspond to
the 90% confidence level interval.
Current usage metrics show cumulative count of Article Views (full-text article views including HTML views, PDF and ePub downloads, according to the available data) and Abstracts Views on Vision4Press platform.
Data correspond to usage on the plateform after 2015. The current usage metrics is available 48-96 hours after online publication and is updated daily on week days.
Initial download of the metrics may take a while.