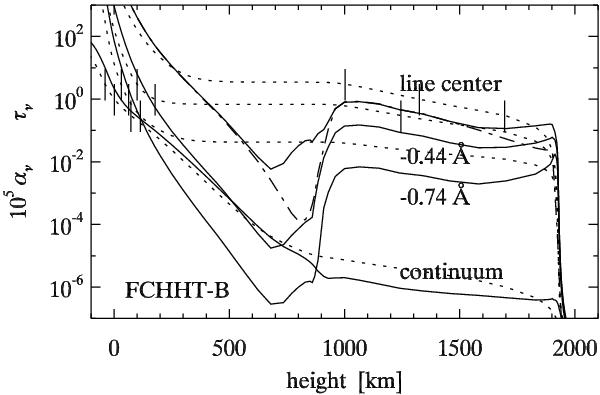
Fig. 9

Solid: Hα line extinction coefficients  per m against height for the FCHHT-B model, at line center and in the blue wing at Δλ = −0.44 and − 0.74 Å, and the continuous opacity
  in the adjacent continuum. The dot-dashed curve is the line-center result for LTE. The opacities are multiplied by a scale height of 105 m to make them comparable to the corresponding optical depth scales (dotted curves). The tick marks on the latter correspond to τν = 3,1,0.3. Across the opacity dip due to the temperature minimum the optical depth is τν = 3.5,0.7,0.04 at the three line wavelengths, respectively.
Current usage metrics show cumulative count of Article Views (full-text article views including HTML views, PDF and ePub downloads, according to the available data) and Abstracts Views on Vision4Press platform.
Data correspond to usage on the plateform after 2015. The current usage metrics is available 48-96 hours after online publication and is updated daily on week days.
Initial download of the metrics may take a while.


