Fig. 8
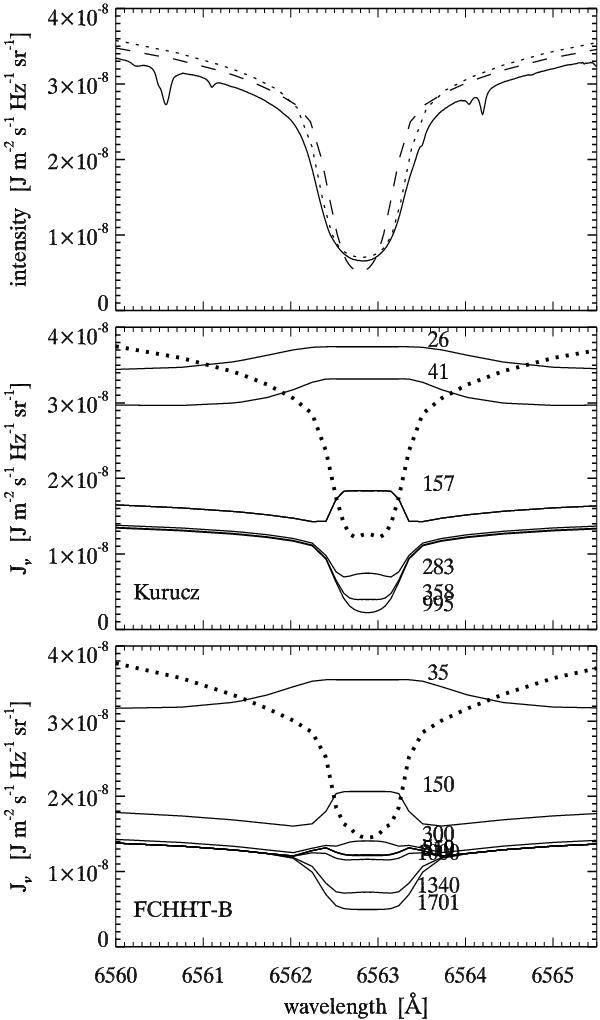
Top panel: emergent Hα intensity profiles at disk center computed from the FCHHT-B (dotted) and Kurucz (dashed) models, in comparison with the observed spatially-averaged profile (solid) taken from the atlas observed by Brault & Testerman, calibrated by Neckel & Labs (1984), and posted by Neckel (1999). Lower panels: mean intensity Jν across Hα at different heights in the Kurucz and FCHHT-B atmospheres, respectively. For the Kurucz panel the sampling heights are 26, 41, 157, 283, 358 and 995 km. For the FCHHT-B panel they are 35, 150, 300, 519, 850, 1000, 1340 and 1701 km. The dotted profile in the bottom panel is the outward intensity at height 850 km, impinging on the FCHHT-B chromosphere. The dotted profile in the middle panel is the outward intensity at height 252 km in the Kurucz model where the line-center optical depth equals the optical thickness τν = 3.5 of the FCHHT-B chromosphere.
Current usage metrics show cumulative count of Article Views (full-text article views including HTML views, PDF and ePub downloads, according to the available data) and Abstracts Views on Vision4Press platform.
Data correspond to usage on the plateform after 2015. The current usage metrics is available 48-96 hours after online publication and is updated daily on week days.
Initial download of the metrics may take a while.