Fig. 5
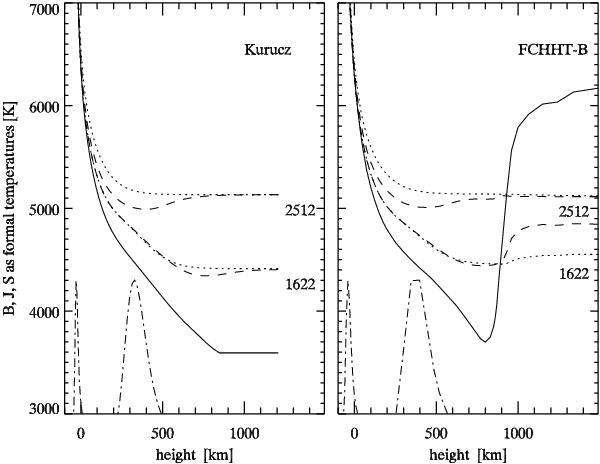
The Planck function Bν (solid), mean radiation Jν (dotted), and source function Sν (dashed) averaged over the first 100 Å of the Mg I edges with thresholds at λ = 2512.4 and 1621.5 Å. Left: Kurucz model. Right: FCHHT-B model. Formal representative temperatures are plotted for these quantities: the electron temperature for Bν, radiation temperature for Jν, and excitation temperature for Sν. They are obtained by applying the inverse Planck function to Bν,Jν,Sν, respectively. The dot-dashed distributions at the bottom are the intensity contribution functions jν exp( − τν), with jν the emissivity and τν the optical depth,near the thresholds wavelengths. The lefthand deeper-formed curve is for the 2512 Å edge. Each curve is scaled to its maximum value.
Current usage metrics show cumulative count of Article Views (full-text article views including HTML views, PDF and ePub downloads, according to the available data) and Abstracts Views on Vision4Press platform.
Data correspond to usage on the plateform after 2015. The current usage metrics is available 48-96 hours after online publication and is updated daily on week days.
Initial download of the metrics may take a while.