Fig. 3
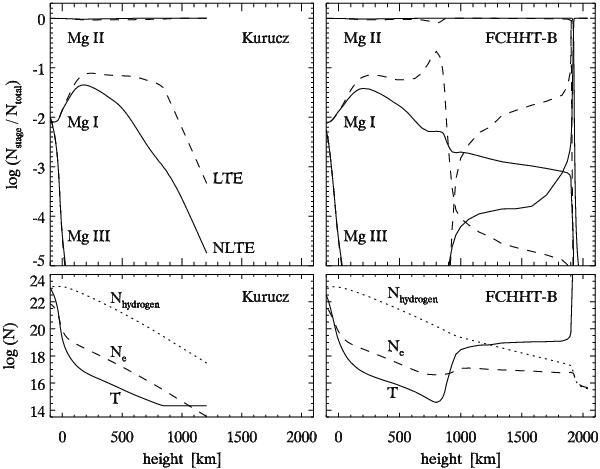
Upper panels: magnesium ionization fractions Nstage/Ntotal in the Kurucz model (left) and the FCHHT-B model (right), with Nstage the summed populations per ionization stage, Ntotal the total of all stages. Solid: NLTE. Dashed: LTE. Lower panels: gradient comparisons. The y-axis units specify the logarithmic electron density Ne and total hydrogen density NH in particles m-3. The temperature curves show 20 log (T) − 57 to provide comparable gradients.
Current usage metrics show cumulative count of Article Views (full-text article views including HTML views, PDF and ePub downloads, according to the available data) and Abstracts Views on Vision4Press platform.
Data correspond to usage on the plateform after 2015. The current usage metrics is available 48-96 hours after online publication and is updated daily on week days.
Initial download of the metrics may take a while.