Fig. 11
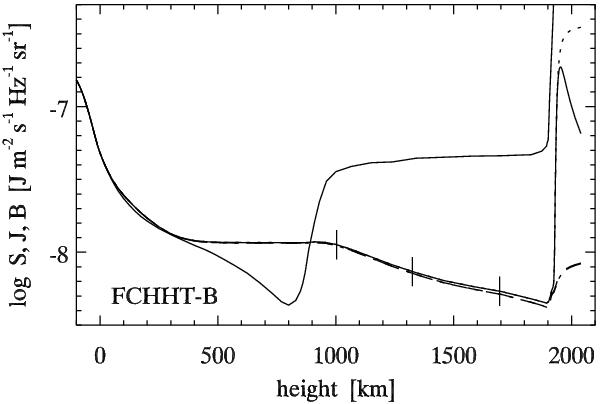
Hα source function comparisons for the FCHHT-B model. Solid: Planck function and total source function at line center. The latter has ticks at τν0 = 3,1,0.3. Dotted: line source function  , differing from the total source function only at the very top of the atmosphere. Dashed and dot-dashed: two-level approximation
  and profile-averaged mean intensity
  . These coincide everywhere.
Current usage metrics show cumulative count of Article Views (full-text article views including HTML views, PDF and ePub downloads, according to the available data) and Abstracts Views on Vision4Press platform.
Data correspond to usage on the plateform after 2015. The current usage metrics is available 48-96 hours after online publication and is updated daily on week days.
Initial download of the metrics may take a while.