Fig. 8
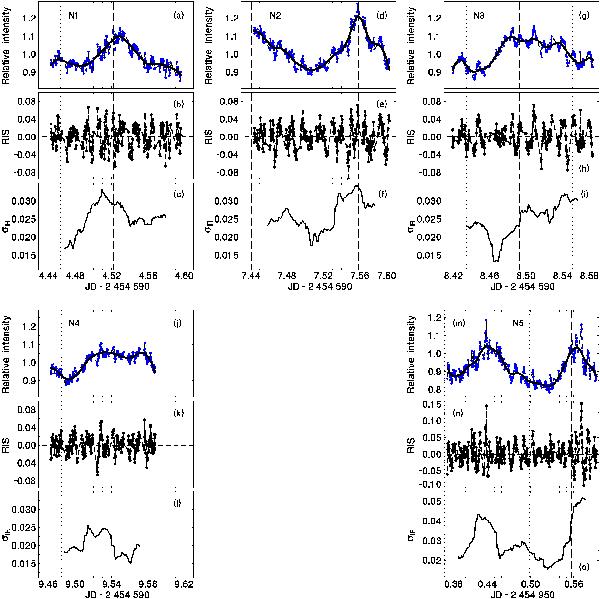
Individual night series of V795 Her in relative intensity units. For each night, the upper panel represents the observed V-band data (panels a), d), g), j), m)). A solid line represents the HEC13 fit. Residuals of this fit, RIS, are given in the middle panel of that night (panels b), e), h), k), n)). Moving averages of the standard deviation of these residuals, σIR, are plotted in the bottom panel of the night (panels c), f), i), l), o)). The vertical dashed and dotted lines mark Φsh = 0.0 and Φsh = 0.5. The ephemeris for S3 (Table 2) was used for panels m), n), o). The quantities Φsh in the remaining panels were calculated according to the ephemeris for S1 (Table 2). See Sect. 4.2 for details.
Current usage metrics show cumulative count of Article Views (full-text article views including HTML views, PDF and ePub downloads, according to the available data) and Abstracts Views on Vision4Press platform.
Data correspond to usage on the plateform after 2015. The current usage metrics is available 48-96 hours after online publication and is updated daily on week days.
Initial download of the metrics may take a while.