Fig. 10
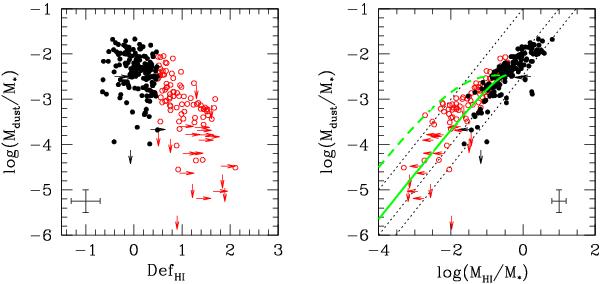
Left: the relation between dust-to-stellar mass and HI deficiency. Right: the relation between dust-to-stellar mass and HI-to-stellar mass ratio. The dotted lines indicate constant HI-to-dust ratios of (from left to right): 30-100-300. The green lines indicate two different models of dust stripping assuming a constant (dashed) or exponential (solid) Hi surface density profile. See text for details. Symbols are as in Fig. 6.
Current usage metrics show cumulative count of Article Views (full-text article views including HTML views, PDF and ePub downloads, according to the available data) and Abstracts Views on Vision4Press platform.
Data correspond to usage on the plateform after 2015. The current usage metrics is available 48-96 hours after online publication and is updated daily on week days.
Initial download of the metrics may take a while.