Fig. 7
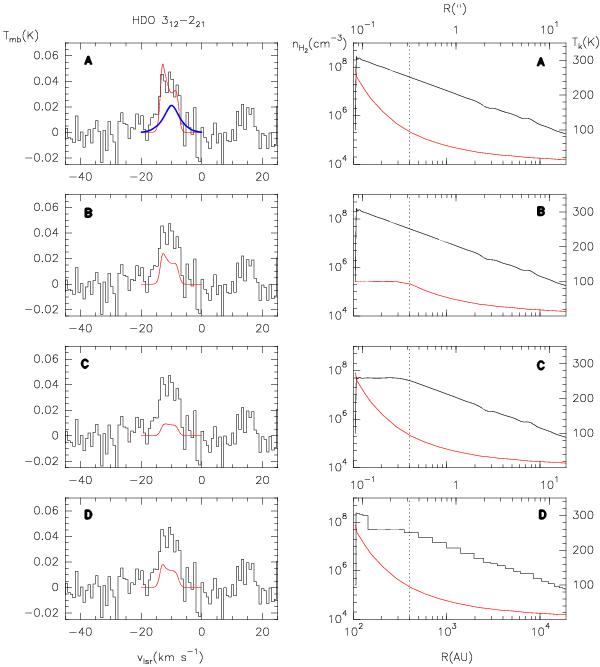
Comparison between HDO 312 → 221 line observed with the 30 m telescope and the results of our HDO model. On the right we show the density (black) and temperature (red) profiles assumed in each case. The angular (upper axis) and spatial (lower axis) scales are indicated. The dashed line marks the extension of the hot core. On the left, we compare the predicted spectra with our observations for each case. A) In this model we adopt Xin = 4 × 10⁻⁸ and Xout = 1 × 10⁻⁸. The red line corresponds to the collapse profile described in Sect. 4.1. The blue line corresponds to the same abundance profile but with a fixed non-thermal linewidth of ~5 km s-1 and without any velocity profile. B) The same as A) but with the temperature in the hot core fixed to 100 K. C) The same as A) but with the molecular hydrogen density in the hot core fixed to 5 × 107 cm-3. D) The same as A) but with the molecular hydrogen density in the hot core fixed to 5 × 107 cm-3 for radii between 150 AU and 300 AU.
Current usage metrics show cumulative count of Article Views (full-text article views including HTML views, PDF and ePub downloads, according to the available data) and Abstracts Views on Vision4Press platform.
Data correspond to usage on the plateform after 2015. The current usage metrics is available 48-96 hours after online publication and is updated daily on week days.
Initial download of the metrics may take a while.