Fig. 2
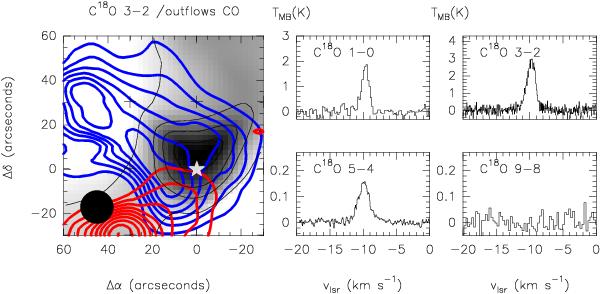
Left: integrated intensity map of the C18O J = 3 → 2 line as observed with the JCMT. Crosses mark the observed positions and the star indicates the position of FIRS 2 (RA (J2000) = 21h43m01 7 Dec(J2000) = 66°03′23′′). The grey scale varies linearly between 1 K km s-1 and 5.5 K km s-1, and the thin black contours correspond to 1.5, 3.0, 4.0, and 5.0 K km s-1. The JCMT beam is shown in the bottom-left corner. The red and blue contours are adapted from Fig. 1d of Fuente et al. (2001) and trace the high velocity CO J = 2 → 1 emission, the contours start at 10 K km s-1 and increase in steps of 5 K km s-1. Right: spectra of the C18O J = 1 → 0, J = 3 → 2, J = 5 → 4 and J = 9 → 8 lines towards FIRS 2.
Current usage metrics show cumulative count of Article Views (full-text article views including HTML views, PDF and ePub downloads, according to the available data) and Abstracts Views on Vision4Press platform.
Data correspond to usage on the plateform after 2015. The current usage metrics is available 48-96 hours after online publication and is updated daily on week days.
Initial download of the metrics may take a while.