Free Access
Fig. 1
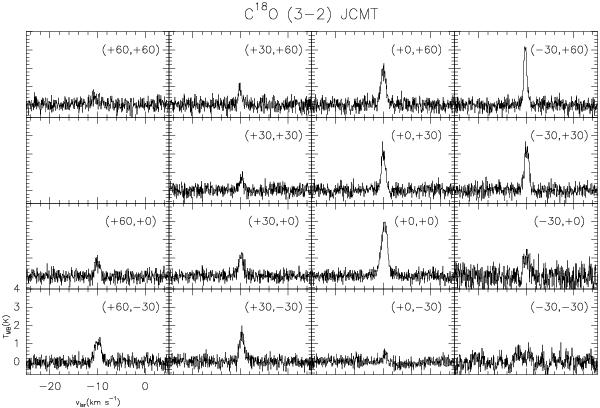
Spectral map of the C18O 3 → 2 line observed with the JCMT telescope. The intensity scale is main brightness temperature. The (0, 0) position corresponds to 21h43m01 7 66°03′23.0′′ (J2000). One spectrum was lost because of instrumental problems.
Current usage metrics show cumulative count of Article Views (full-text article views including HTML views, PDF and ePub downloads, according to the available data) and Abstracts Views on Vision4Press platform.
Data correspond to usage on the plateform after 2015. The current usage metrics is available 48-96 hours after online publication and is updated daily on week days.
Initial download of the metrics may take a while.