Fig. 7
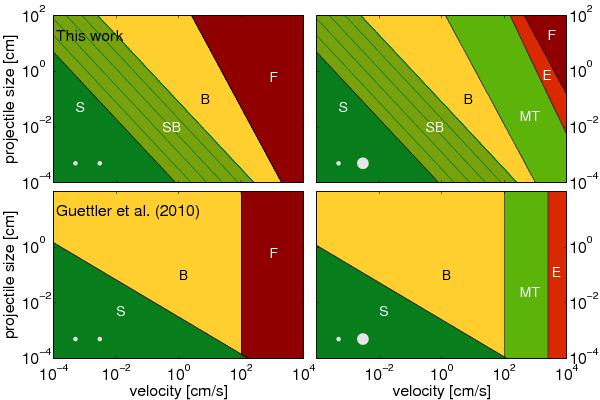
Comparison between the new collision model (top) and the model of Güttler et al. (2010) (bottom). The left and right panels show the outcome for equal- and differently sized collisions, respectively. Green regions mark collisions that are growth-positive for the target, yellow marks growth-neutral, and red marks growth-negative. “S” marks sticking, “SB” the sticking to bouncing transition, “B” bouncing, “MT” net mass transfer, “E” net erosion, and “F”, fragmentation. In the transition region, the green parallel lines each mark a decrease in sticking probability by 20%.
Current usage metrics show cumulative count of Article Views (full-text article views including HTML views, PDF and ePub downloads, according to the available data) and Abstracts Views on Vision4Press platform.
Data correspond to usage on the plateform after 2015. The current usage metrics is available 48-96 hours after online publication and is updated daily on week days.
Initial download of the metrics may take a while.