Fig. 4
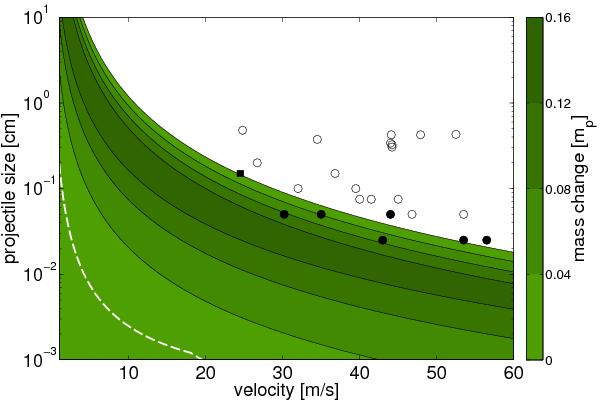
The threshold between growth and erosion from the model compared to the mass-transfer experiments performed by Teiser & Wurm (2009b). Filled circles show experiments where the target gained mass, and open circles where it lost mass. The white dotted line shows the threshold for the highly uncertain erosion prescription from cratering experiments (collisions above the line result in erosion, and collisions below result in growth). The contours are in intervals of 4% net accretion efficiency and mark the region with net growth in the final prescription calibrated using the Teiser & Wurm data.
Current usage metrics show cumulative count of Article Views (full-text article views including HTML views, PDF and ePub downloads, according to the available data) and Abstracts Views on Vision4Press platform.
Data correspond to usage on the plateform after 2015. The current usage metrics is available 48-96 hours after online publication and is updated daily on week days.
Initial download of the metrics may take a while.