Free Access
Fig. 13
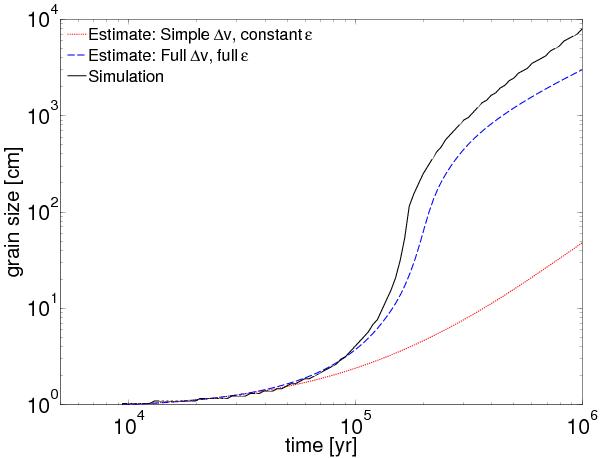
The growth of a boulder in the simulations (black) compared to two growth estimates. The red line corresponds to the simplified analytical estimate, and the blue line to the estimate using the full relative velocity and accretion efficiency prescriptions.
Current usage metrics show cumulative count of Article Views (full-text article views including HTML views, PDF and ePub downloads, according to the available data) and Abstracts Views on Vision4Press platform.
Data correspond to usage on the plateform after 2015. The current usage metrics is available 48-96 hours after online publication and is updated daily on week days.
Initial download of the metrics may take a while.