Fig. 11
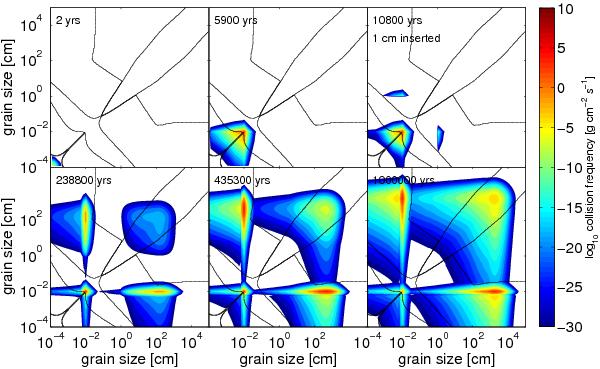
The collision frequency map for the scenario where 1 cm-particles are artificially inserted at t = 10 800 years. The interaction frequency is plotted for each particle pair at six different timesteps plotted on top of the collision outcome space of Fig. 8. This makes it possible to identify the dominating interaction for each particle size. Note the persistently high peak of interactions with particles stuck below the bouncing barrier at 1 mm in size. As the large particles grow, they also sometimes collide among themselves, producing a tail of particles capable of also sweeping up the bouncing particles. This causes an increase in both mass and number for the large particles, and a continuous widening of the size-distribution.
Current usage metrics show cumulative count of Article Views (full-text article views including HTML views, PDF and ePub downloads, according to the available data) and Abstracts Views on Vision4Press platform.
Data correspond to usage on the plateform after 2015. The current usage metrics is available 48-96 hours after online publication and is updated daily on week days.
Initial download of the metrics may take a while.