Fig. 1
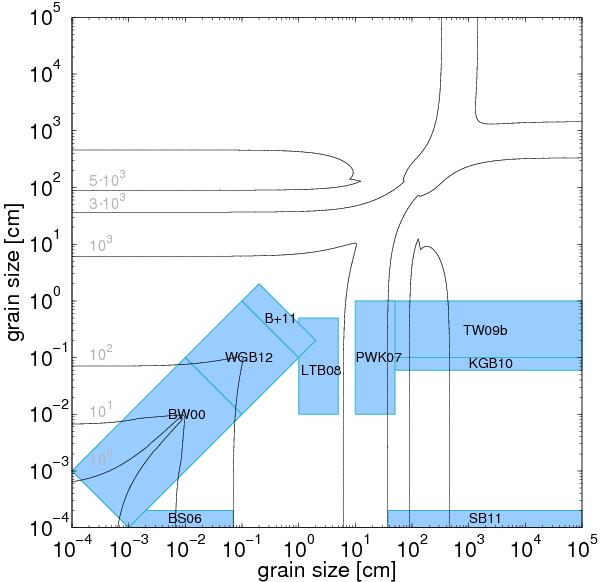
The size-size parameter space of the dust collision experiments (blue boxes) providing the basis for the new collision model. All marked experiments are discussed in more detail in Sect. 2.1. The contours and gray labels mark the collision velocities in cm s-1 expected from the disk model described in Sect. 4.1, and do not always coincide with the velocities studied in the experiments.
Current usage metrics show cumulative count of Article Views (full-text article views including HTML views, PDF and ePub downloads, according to the available data) and Abstracts Views on Vision4Press platform.
Data correspond to usage on the plateform after 2015. The current usage metrics is available 48-96 hours after online publication and is updated daily on week days.
Initial download of the metrics may take a while.