Fig. 4
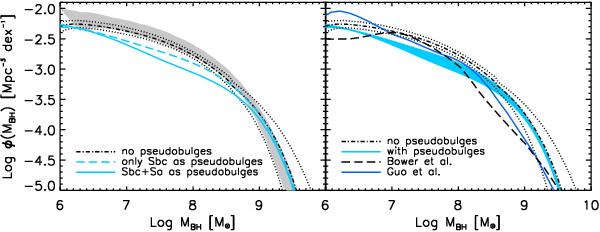
Left panel: estimate of the local black hole mass function derived by convolution of the galaxy velocity dispersion function and the Mbh-σ relation considering all bulges as classical (dot-dashed and dotted lines), compared to the collection of estimates from Shankar et al. (2009, grey band. The cyan solid line is the estimate of the local black hole mass function assuming that all Sbc+Sa galaxies follow the Hu (2012)Mbh-σ relation proper of pseudobulges. The cyan dot-dashed line is the local black hole mass function obtained assuming that only Sbc are pseudobulges. Right panel: predicted local black hole mass function from the Bower et al. (2006) and Guo et al. (2011) models (black long-dashed and blue solid lines, respectively) compared with the local mass function not corrected (dot-dashed and dotted lines) and corrected for pseudobulges (cyan area, combination of the dot-dashed and solid lines in the left panel).
Current usage metrics show cumulative count of Article Views (full-text article views including HTML views, PDF and ePub downloads, according to the available data) and Abstracts Views on Vision4Press platform.
Data correspond to usage on the plateform after 2015. The current usage metrics is available 48-96 hours after online publication and is updated daily on week days.
Initial download of the metrics may take a while.