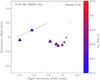
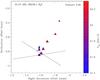
Fig. 3
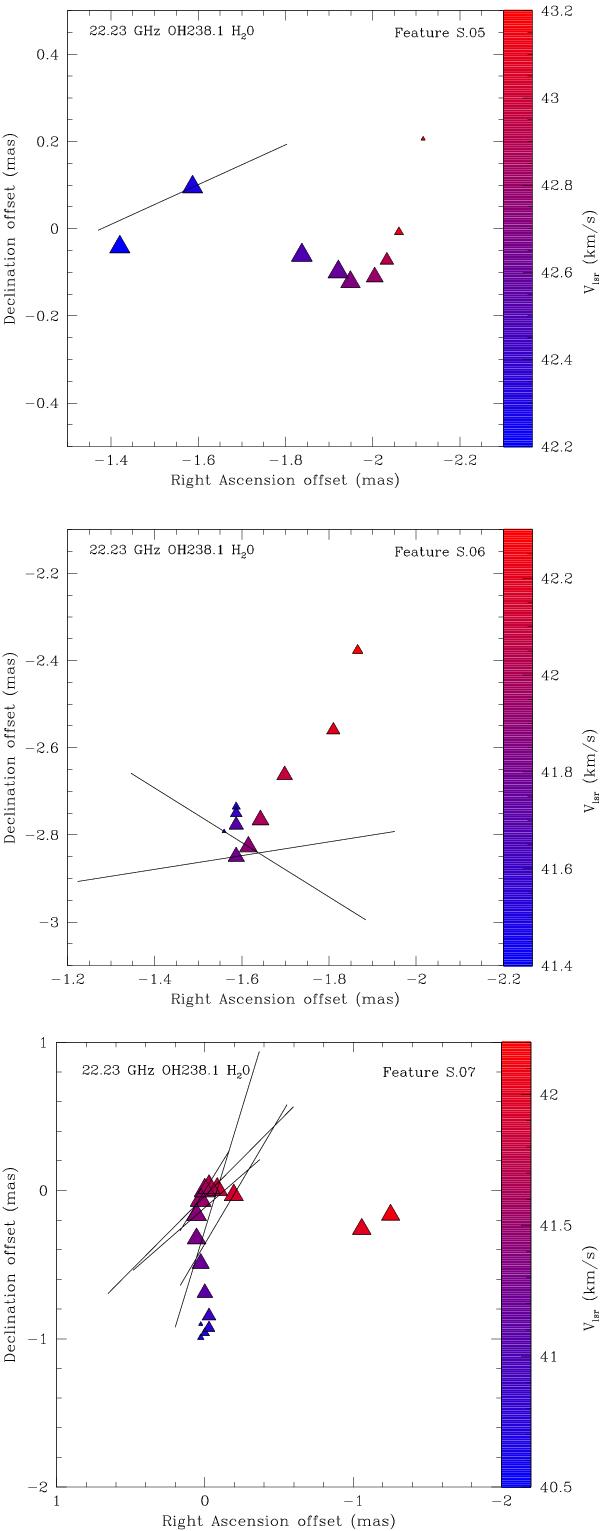
Maser spots of the features S.05, S.06 and S.07. The triangle sizes are scaled to the intensity of each spot emission; the color scale shows how the velocity varies at each spot; and the black lines show the direction of linear polarization for those spots that have survived to the polarization threshold cut. The size of the black lines are scaled to the linearly-polarized intensity measured for each spot.
Current usage metrics show cumulative count of Article Views (full-text article views including HTML views, PDF and ePub downloads, according to the available data) and Abstracts Views on Vision4Press platform.
Data correspond to usage on the plateform after 2015. The current usage metrics is available 48-96 hours after online publication and is updated daily on week days.
Initial download of the metrics may take a while.