Fig. 1
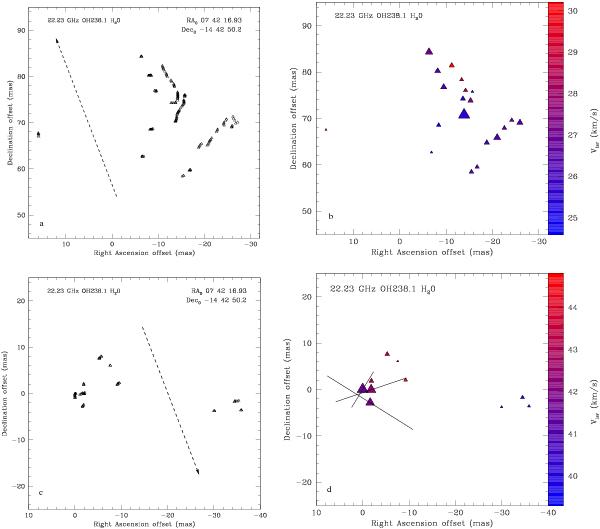
Plots a) and b) (top) corresponds to NReg, and plots c) and d) (bottom) to SReg. Plots a) and c) (left) show the position of all the measured maser spots, and plots b) and d) (right) present the maser features. On plots a) and c) the dashed vectors indicate the direction of the pPN jet. On plots b) and d) the size of the triangles are scaled by the maser fluxes, and the color scale is related to the velocity. The black lines represent the EVPA and intensity of the linear polarization.
Current usage metrics show cumulative count of Article Views (full-text article views including HTML views, PDF and ePub downloads, according to the available data) and Abstracts Views on Vision4Press platform.
Data correspond to usage on the plateform after 2015. The current usage metrics is available 48-96 hours after online publication and is updated daily on week days.
Initial download of the metrics may take a while.