Fig. 8
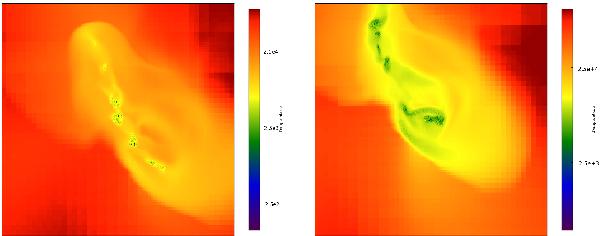
Density weighted projections of temperature for different internal UV field strengths and dust-to-gas ratios at redshift 5.4. The left panel shows the temperature for model G. The temperature for model H is depicted in the right panel. The panels show temperatures corresponding to the density panels of Fig. 7. This shows that thermal instability leads to the formation of gas clumps at these temperatures. The values of temperature are shown in the colorbar.
Current usage metrics show cumulative count of Article Views (full-text article views including HTML views, PDF and ePub downloads, according to the available data) and Abstracts Views on Vision4Press platform.
Data correspond to usage on the plateform after 2015. The current usage metrics is available 48-96 hours after online publication and is updated daily on week days.
Initial download of the metrics may take a while.