Free Access
Fig. 3
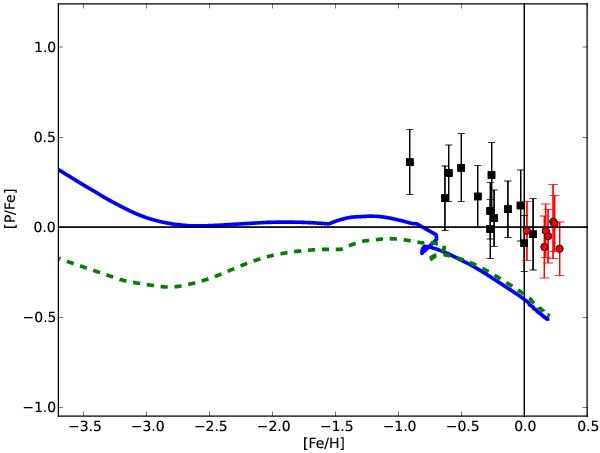
Predictions from Model 5 (blue solid line) and Model 6 (green dashed line). The P and Fe abundances in both models are normalized with the absolute solar values of Caffau et al. (2011). In Table 1 we list the predicted ratios at the age of formation of the solar system. The data are the same as in Fig. 1.
Current usage metrics show cumulative count of Article Views (full-text article views including HTML views, PDF and ePub downloads, according to the available data) and Abstracts Views on Vision4Press platform.
Data correspond to usage on the plateform after 2015. The current usage metrics is available 48-96 hours after online publication and is updated daily on week days.
Initial download of the metrics may take a while.