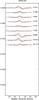
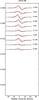
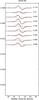
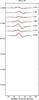
Fig. 1
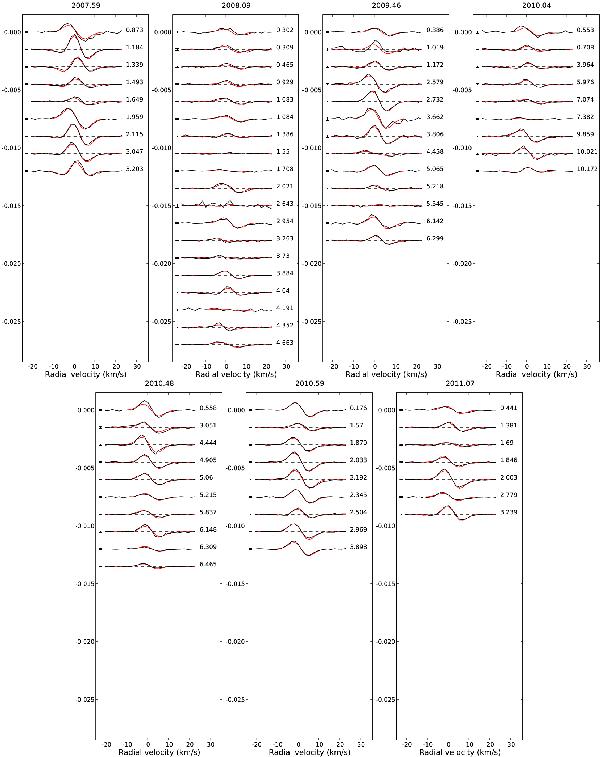
Normalized Stokes V profiles (V/Ic) of ξ Boo A for 2007.59, 2008.09, 2009.46, 2010.04, 2010.48, 2010.59 and 2011.07 (from left to right and top to bottom), after correction for the mean radial velocity of the star (the radial velocity values are listed in Table 2). Black lines represent the data and red lines correspond to synthetic profiles of our magnetic model. Successive profiles are shifted vertically for display clarity. Rotational phases of observations are indicated in the right-hand part of the plot and error bars are illustrated on the left side of each profile.
Current usage metrics show cumulative count of Article Views (full-text article views including HTML views, PDF and ePub downloads, according to the available data) and Abstracts Views on Vision4Press platform.
Data correspond to usage on the plateform after 2015. The current usage metrics is available 48-96 hours after online publication and is updated daily on week days.
Initial download of the metrics may take a while.