Fig. 3
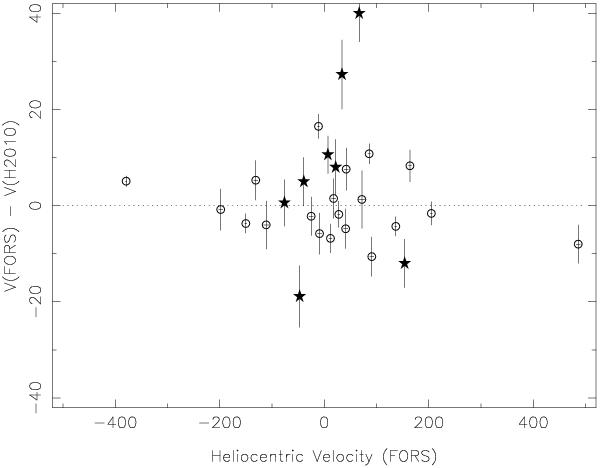
The velocity differences between our values and those of H10 are plotted here versus our velocities. The open circles are for clusters where Harris lists an error of less than 2 km s-1 and filled stars are for clusters where the H10 listed error exceeds 2 km s-1. The vertical error bars are given by the quadratic sum of our and H10 errors.
Current usage metrics show cumulative count of Article Views (full-text article views including HTML views, PDF and ePub downloads, according to the available data) and Abstracts Views on Vision4Press platform.
Data correspond to usage on the plateform after 2015. The current usage metrics is available 48-96 hours after online publication and is updated daily on week days.
Initial download of the metrics may take a while.