Fig. 11
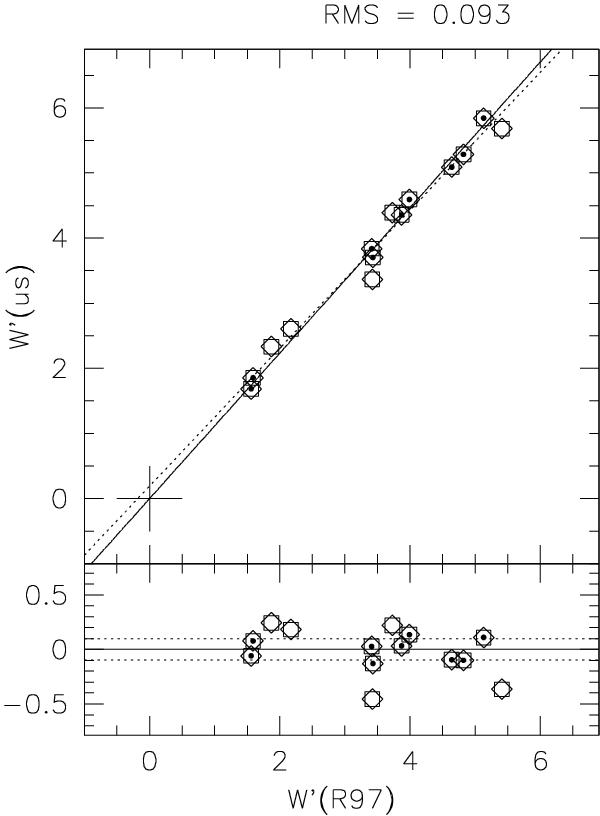
In the upper panel reduced equivalent widths of calibration clusters on our scale are plotted against those of R97. The data were fit with a linear relation passing through (0,0), and a 1σ rejection was also applied after a preliminary fit. This leaves the clusters represented by encircled dots. A free linear fit to the whole sample is represented by the dotted line. In the lower panel the difference of our ⟨W′⟩ minus the converted R97 ones is shown, and the average difference ± σ are shown by the solid and dotted lines, respectively.
Current usage metrics show cumulative count of Article Views (full-text article views including HTML views, PDF and ePub downloads, according to the available data) and Abstracts Views on Vision4Press platform.
Data correspond to usage on the plateform after 2015. The current usage metrics is available 48-96 hours after online publication and is updated daily on week days.
Initial download of the metrics may take a while.